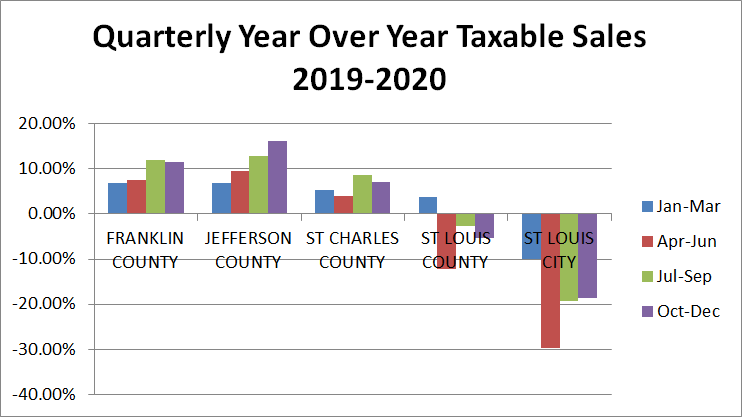
The economic fallout from the pandemic has been very tough. One area that it has been reflected is in taxable sales. But it hasn’t been equal across the region. In the second and third quarters of 2020 we saw ZIP codes dependent on visitors and bars and restaurants losing big while in others like north St. Louis saw gains- wealth coming home thru spending near home and online.
I’ve long said reliance on sales taxes, the favorite of politicians and voters lately, is a risky way to fund local government rendering them more vulnerable to economic shocks. It’s simple- when times get tough people dial back spending by delaying/foregoing purchases and buying cheaper substitutes. We saw how much taxable sales plummeted during the Great Recession. Some municipalities turned to tickets and fines to fill the gap which blew up spectacularly. It appears we’ve learned nothing in the intervening decade with numerous sales tax increases put on ballots and passing and more TIFs for retail designed to lure non-resident shoppers across municipal boundaries. Source data are from the Missouri Department of Revenue.
Nextstl – Third Quarter 2020 Taxable Sales
Nextstl – Second Quarter 2020 Taxable Sales Down Dramatically In Some ZIP Codes
Nextstl – Regional Taxable Sales
Nextstl – University City Big Box Plan Exemplifies All That Is Wrong
Nextstl – Des Peres Discovers Its Fragility
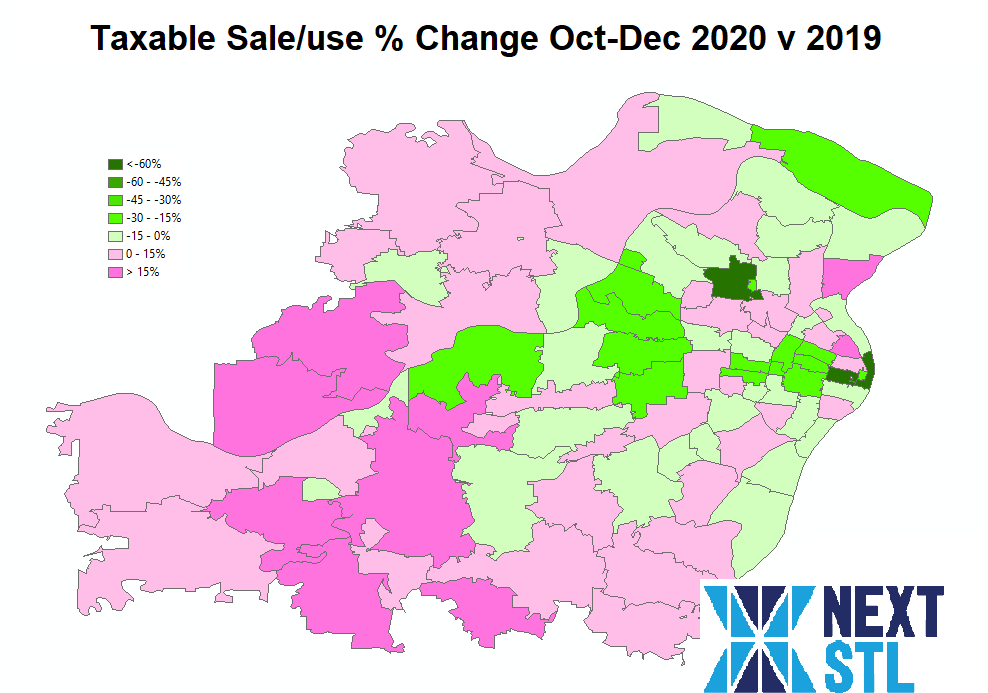
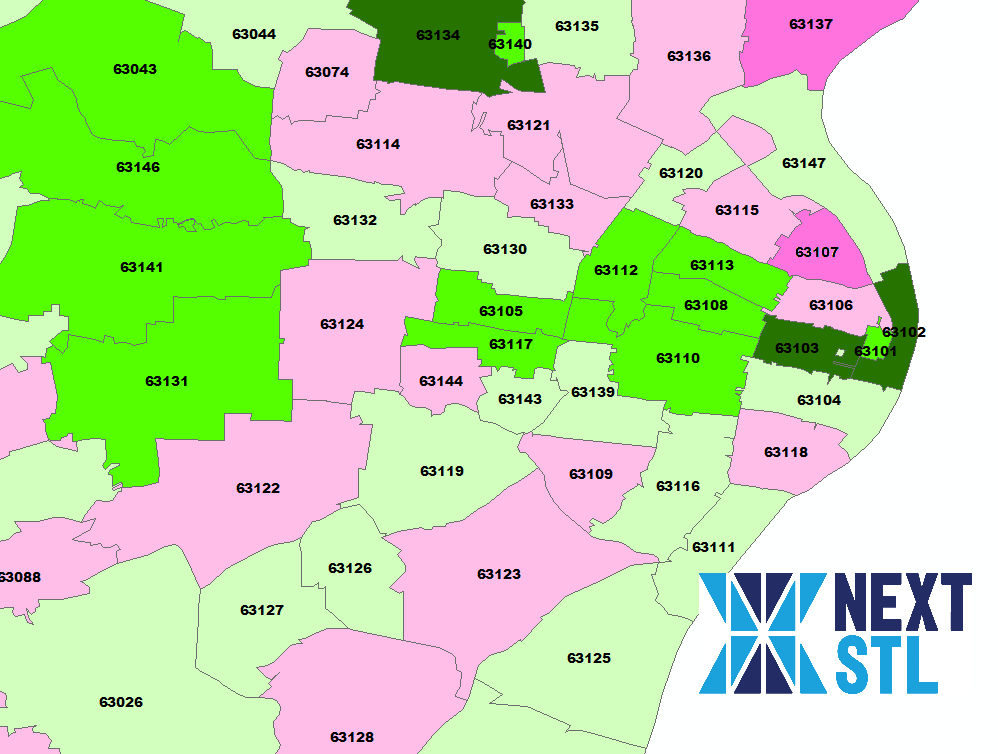
Again the central corridor was hit hardest. North and south did better. The eleven ZIP codes with the biggest drops in the fourth quarter:
| 63102 | -71% | Downtown |
| 63134 | -66% | Berkeley and Woodson Terrace |
| 63103 | -65% | Downtown West and Midtown |
| 63145 | -51% | Airport |
| 63146 | -29% | Unincorporated Area between Maryland Heights and Creve Ceuor |
| 63386 | -28% | West Alton, St. Charles County |
| 63117 | -24% | Richmond Heights |
| 63105 | -23% | Clayton |
| 63108 | -24% | Central West End |
| 63131 | -22% | Town and Country |
| 63140 | -22% | Kinloch |
| 2020 v 2019 | Q1 | Q2 | Q3 | Q4 |
| CWE BUSINESS CID | -14.36% | -51.18% | -38.10% | -45.82% |
| CHEROKEE STREET CID | 0.37% | -11.67% | -3.53% | -4.07% |
| CHESTERFIELD VALLEY TDD | -8.33% | -31.31% | -10.95% | -13.32% |
| DOWNTOWN CID | -2.75% | -44.53% | -25.45% | -21.44% |
| EUCLID SOUTH CID | -6.31% | -44.61% | -26.27% | -21.96% |
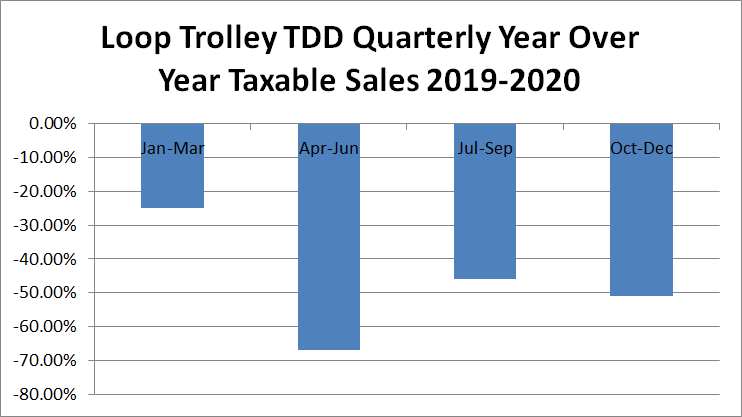
| LOOP TROLLEY TDD | -25.08% | -66.93% | -45.90% | -50.90% |
| SOUTH GRAND CID | -5.51% | -42.14% | -26.11% | -12.39% |
Performance of some of the CIDs and TDDs reveals just how oriented places are to visitors, students, bars, and restaurants.
Will we learn anything this time? Is a high portion of local government revenue from sales taxes wise? An example of a different way- the East Loop CID raises funds through an assessment based on land area and square footage of improvements with a lower rate for square feet of upper floors. What about chasing more and more visitors (especially leveraging fragmentation for non-resident intraregional shopper)? Let’s instead focus on building great places for the people already there and enable more people to live there. Then there would be people there 7 days a week to keep the local economy resilient. Visitors will come to lovable places focused on people over places accommodating cars from elsewhere. Let’s take this shock on our system to reexamine our approach.
