St. Louis Zoo leaders are lobbying the Missouri Legislature to authorize a sales tax to raise additional funds for the Zoo. If successful 4 counties and a city not within a county could propose to voters a sales tax of up to 0.125%. Currently $20M of the Zoo’s $60M annual budget comes from a $0.08 per $100 assessed property tax in St. Louis City and County. Less than half the metropolitan area lives in St. Louis City and County so the argument goes that additional taxpayer support should include more counties.
The sales tax has become the favorite of governments big and small. Metro, MoDOT, SLMPD pensions, City Arch River, GRG, CIDs, TDDs, capital improvements, economic development, stormwater, etc. It seems only school districts and MSD haven’t tried one recently.
Among municipalities the incentive structure favors sales taxes and traffic tickets over property taxes. The former apply to people present in the city whereas the latter falls more on voters in the city. Plus a municipality can TIF away other governments’ property tax revenues to subsidize development that has a lot of taxable sales. When the TIF is paid off (or immediately if a fraction is diverted to the TIF), the city reaps the benefits of a sales tax producing land use. Over time cities have become increasingly reliant on sales taxes. The chase for sales taxes has lead to $2B in retail subsidies and yet no increase in retail employment compared to 1990. The perverse incentives might lead Maryland Heights to get in bed with St. Louis’ public enemy #1 to subsidize a flood plain development. Local income taxes are not an option, as they are illegal.
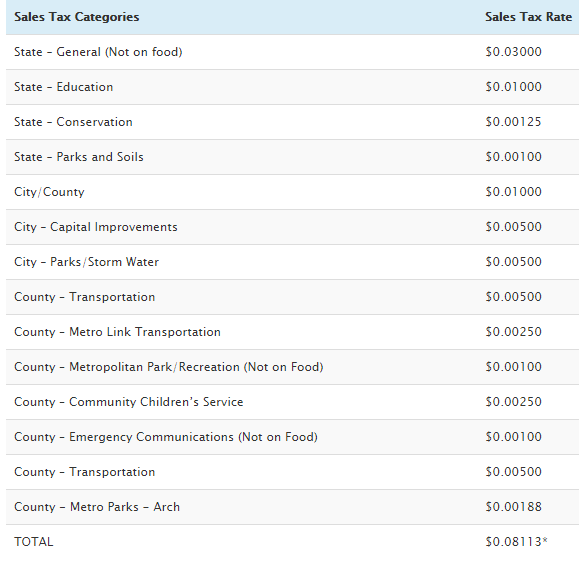 {Sales tax breakdown in Eureka. There are a few more optional sales taxes a city can add. For instance Ferguson passed a 0.5% economic development tax in the last election.}
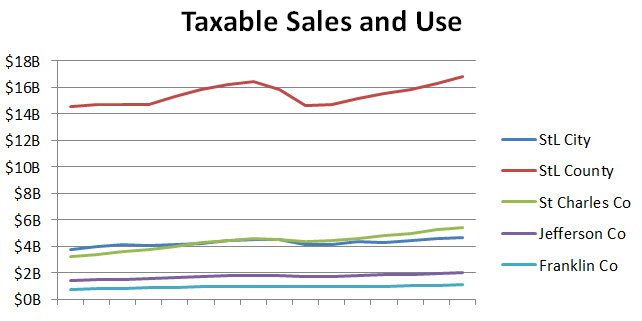
Let’s see how taxable sales and use (use tax is what you’re supposed to be paying for out-of-state purchases like via the internet) have faired since 2000. One multiplies a proposed sales tax increase to this to figure how much revenue it would generate. The Missouri Department of Revenue compiles reports by county, city, and district.
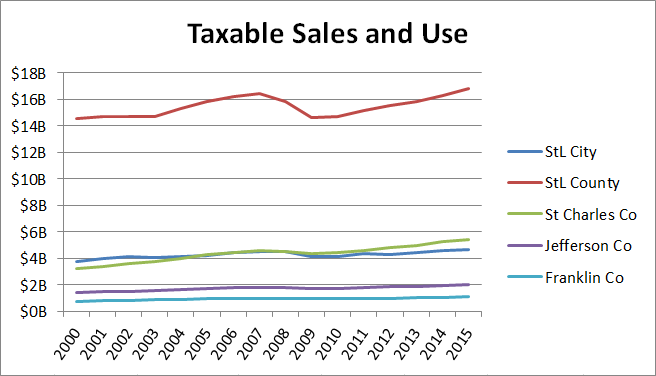
St. Louis County is king. You can see the effect of the recession. Also St. Charles County surpassed St. Louis City in 2007. No surprise as the county has been the winner the last few decades in the spreading-out of the region.
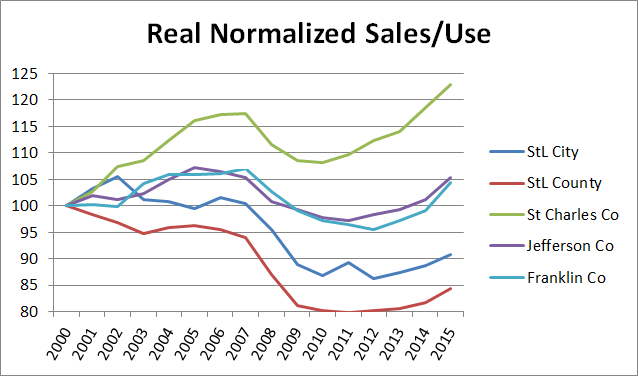
Let’s set 2000 to equal 100 to see how each has changed.
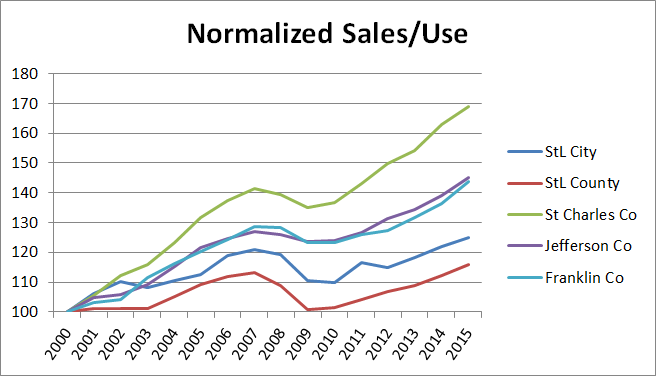
The recession is noticeable in each. St. Charles County’s rise is more pronounced. St. Louis County has performed the worst.
We should take into account inflation.
Only St. Charles County has surpassed pre-recession highs. St. Louis City and County are way below 2000 levels and haven’t recovered much from the recession.
A closer look at St. Charles County’s biggest cities
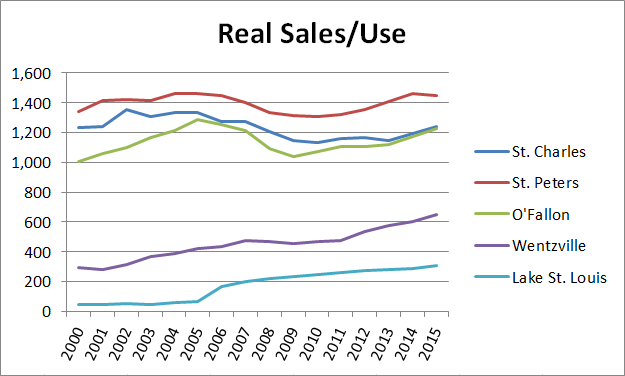
Lake St. Louis saw a big jump in 2006 thanks to new big boxes. Wentzville has done well too.
Setting 2000 equal to 100. I left out Lake St. Louis because it’s up 6.6x 2000-2015, and it dominated the graph.
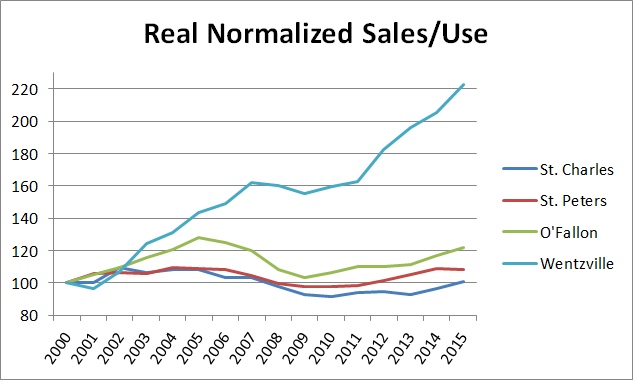
We see within St. Charles County the effect of spreading out. Wentzville and Lake St. Louis have seen big increases, while St. Charles has broken even. Perhaps not coincidentally St. Charles voters will consider a 0.5% sales tax increase for parks and stormwater runoff infrastructure in August. I’ll note sales taxes and property taxes let some of the worst stormwater runoff producers off easy. The Missouri Legislature should allow political subdivisions responsible for stormwater runoff infrastructure to charge impervious surface fees.
What about per capita? I filled in the population for years between 2000, 2010, and 2015 with a linear interpolation.
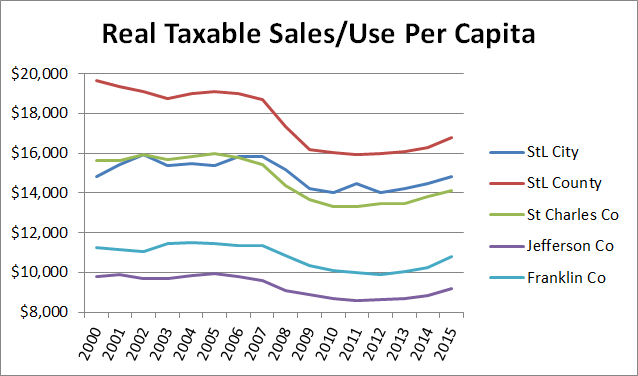
St. Louis County and City come out on top. Per capita gets a boost from visitors. Residents of St. Charles County shopping in Chesterfield Valley, Jefferson County residents shopping at Gravois Bluffs, etc boost St. Louis County. Workers and tourists help boost St. Louis City.
So let’s consider all 4 counties and the city not within a county together.
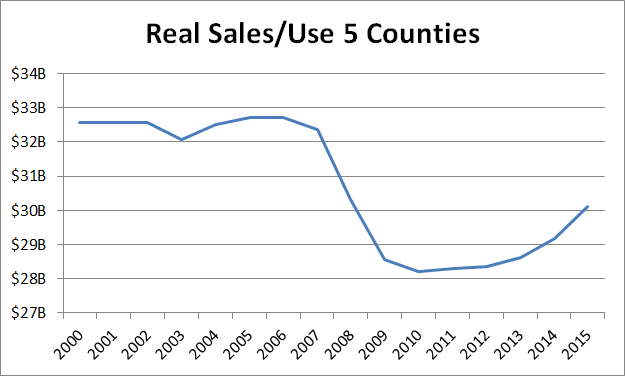
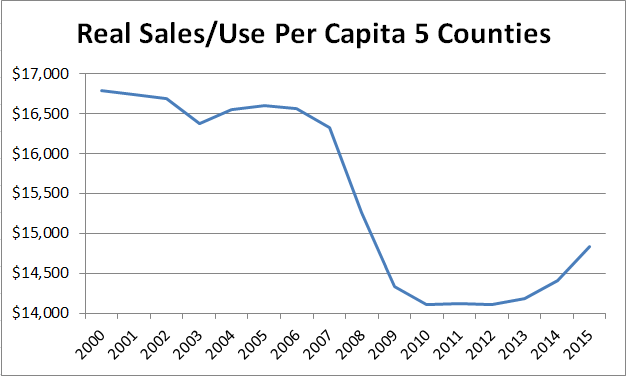
This is where you’re supposed to get concerned if not already. Despite the appearance of growth in the region, taxable sales and use are down 8% from its peak and have recovered only 7% from the bottom in 2010.
I don’t have any profound conclusions for you, just questions. Did the recession reset the baseline? Is this the new normal? What’s the best regional tax, if any? Property assessments don’t suggest property taxes would be much better. Is it fair to pile on more sales taxes when it is one of the most regressive? Should subsidies for retail be curtailed dramatically? Did the last recession find some sort of rigid bottom or might another reach new lows? Should the Zoo start charging admission or more for parking instead of seeking another tax? Is adding infrastructure that enables more spreading-out of the region leaving each person with more to take care of wise in this environment?
