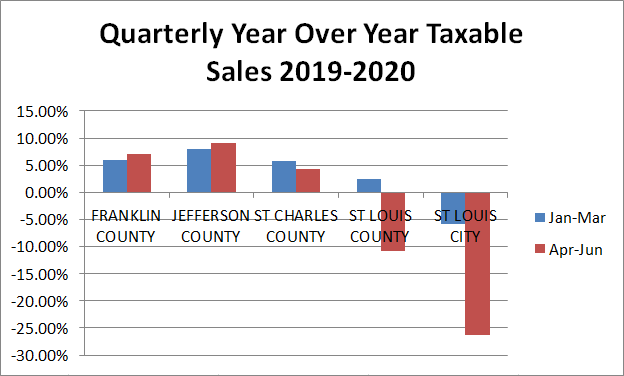
It seems like eons ago, but let’s take a look at the affect of the pandemic in the St. Louis area on taxable sales during the second quarter (Apr-Jun) of 2020. I’ve long said reliance on sales taxes, the favorite of politicians and voters lately, is a risky way to fund local government rendering them more vulnerable to shocks. It’s simple- when times get tough people dial back spending by delaying/foregoing purchases and buying cheaper substitutes. We saw how much taxable sales plummeted during the Great Recession. Some municipalities turned to tickets and fines to fill the gap which blew up spectacularly. It appears we’ve learned nothing in the intervening decade with numerous sales tax increases put on ballots and passing and more TIFs for retail designed to lure non-resident shoppers. Source data are from the Missouri Department of Revenue.
Nextstl – Regional Taxable Sales
Nextstl – University City Big Box Plan Exemplifies All That Is Wrong
Nextstl – Des Peres Discovers Its Fragility
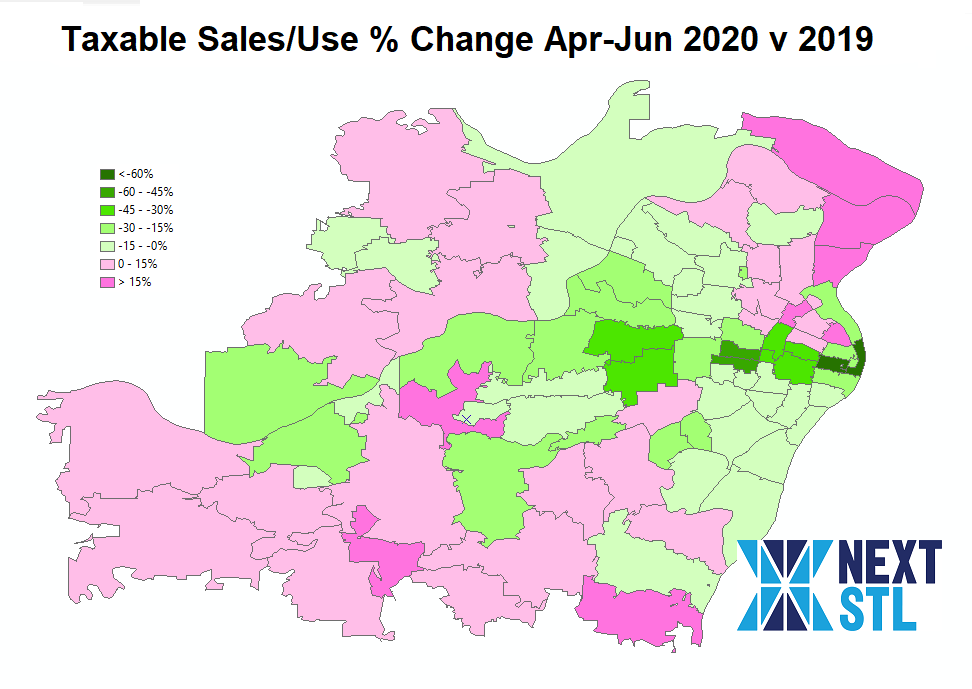
Some ZIP codes were up as a portion of workers stayed home, bought groceries close to home instead of lunch and happy hour near the office, bought online instead of in ZIP codes with retailers, etc.
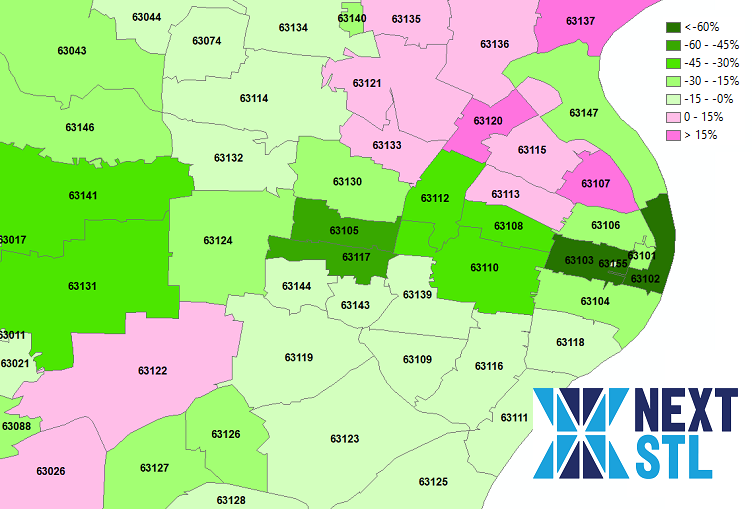
The top ten declining ZIP codes comparing the second quarter of 2020 to 2019.
| 63102 | -89% | Downtown |
| 63145 | -76% | Airport |
| 63103 | -75% | Downtown West and Midtown |
| 63105 | -47% | Clayton |
| 63117 | -46% | Richmond Heights |
| 63131 | -42% | Town and Country |
| 63108 | -34% | Central West End |
| 63112 | -34% | West End, Skinker DeBaliviere, DeBaliviere Place |
| 63141 | -32% | Creve Ceuor |
| 63110 | -31% | FPSE, The Hill, Shaw, Ikea |
The central corridor was hit especially hard. Places dependent on visitors and especially those heavy on bars and restaurants were decimated. Bars and restaurants really took it on the chin.
The CIDs and TDDs give us some insight. The Loop Trolley TDD was down by two thirds.
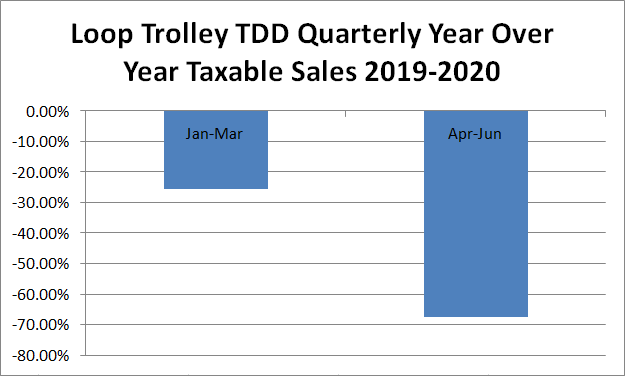
| Q1 2020-19 | Q2 2020-19 | |
| CWE BUSINESS CID | -14.37% | -51.21% |
| CHEROKEE STREET CID | 0.37% | -11.96% |
| CHESTERFIELD VALLEY TDD | -5.96% | -28.34% |
| DOWNTOWN CID | -4.1% | -45.21% |
| EUCLID SOUTH CID | -4.10% | -44.74% |
| LOOP TROLLEY TDD | -25.58% | -67.60% |
Another very special thing shown in this map is that it is one of the very few that shows north St. Louis outperforming the central corridor. I’d wager this is due to increased shopping at home/close to home, relief/unemployment checks, and less spending on gas (no sales tax) and auto maintenance (done in other ZIP codes) substituted with other spending.
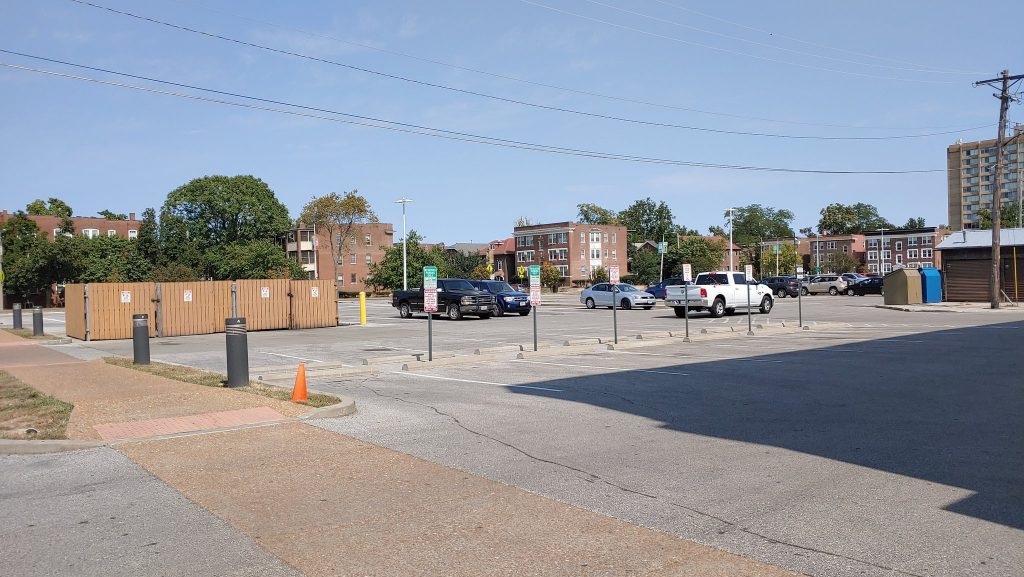
Will we learn anything this time? Is a high portion of local government revenue from sales taxes wise? An example of a different way- the East Loop CID raises funds through an assessment based on land area and square footage of improvements with discounted rate for square feet of upper floors. What about chasing more and more visitors? Let’s instead focus on building great places for the people already there and get more people to live there. Then there would be people there 7 days a week to keep the local economy afloat. Visitors will come to lovable places focused on people over places accommodating cars from elsewhere. Let’s take this shock on our system to reexamine our approach.
