
The previous article, Understanding St. Louis: Total Crime Index and Crime-Ridden Neighborhoods, highlighted how raw crime counts can distort our impression of city neighborhoods and the prevalence of crime. To best understand the material, it's essential to read that article before considering the information below.
Adding the measure of neighborhood population to raw crime counts, as done in the previous article, improves our understanding of crime statistics. But what about the type of crimes and our perception of safety? The FBI uniform crime report includes both crimes against people and crimes against property. The prevalence of particular types of crimes shape perceptions of safety. In many neighborhoods, the high number of larceny-thefts skew the crime index and the number of crimes per 1,000 residents. In this article we move from raw crime numbers and crimes per 1,000 residents, to considering crimes against persons and crimes against property per 1,000 residents.
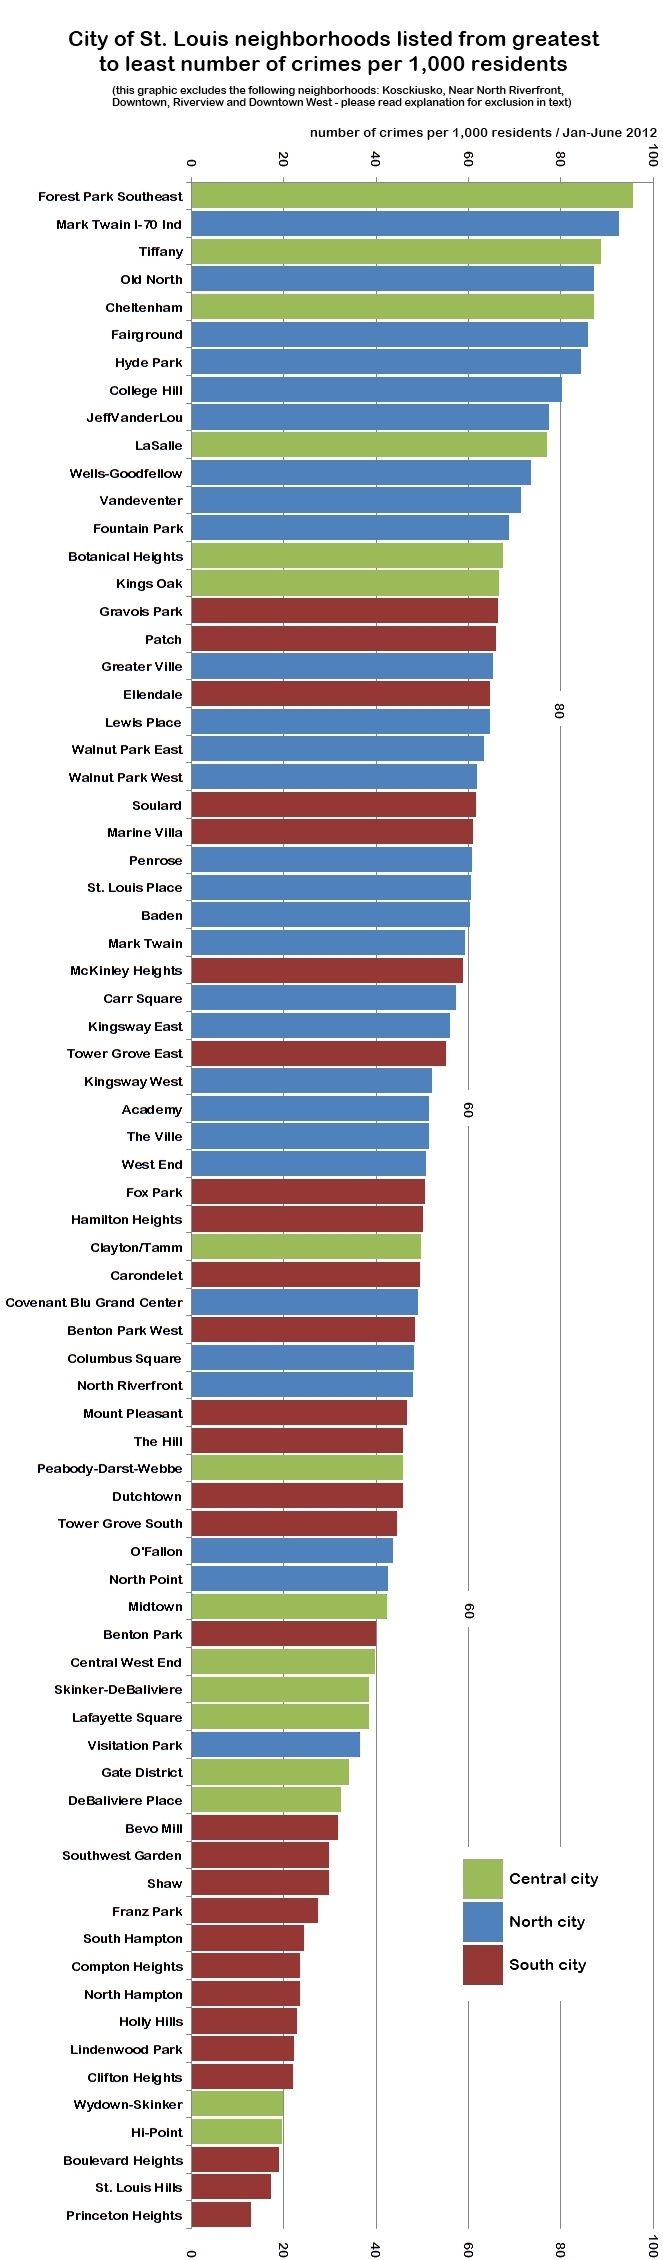
Considering crimes per 1,000 residents provides a starting point and demostrates how raw crime numbers can be deceptive. For example, the central city Kings Oak neighborhood reported just 12 crimes counted for the crime index in the first half of 2012, but it also is home to just 180 residents. Ranked 79, last, by the crime index, Kings Oak rises to 20 with 67 crimes per 1,000 residents. The Central West End and Bevo Mill each drop 54 places.

As we saw previously, looking at the city's 79 neighborhoods by crimes per 1,000 residents, we start to see that south, central and north city neighborhoods are less mixed than when looking at the total crime index. South and central city neighborhoods occupy the bottom 17 spots (fewest crimes per 1,000 residents) and 22 of the bottom 23 (of 79). North and central city neighborhoods occupy 19 of the top 20 spots (most crimes per 1,000 residents), with the 14-resident south city industrial neighborhood of Koskiusko sitting far and away at the top.
What changes if we consider the type of crime? The graphic below shows the number of property crimes per 1,000 residents by neighborhood:

Here we see a mix of south, central and north city neighborhoods, though the first south city residential neighborhood doesn't appear until the 14th spot and only one north side neighborhood, the small Visitation Park, appears among the bottom 17 (fewest property crimes per 1,000 residents). Once again, for Koskiusko (3,500), Near North Riverfront (179), Downtown (165), Riverview (168) and Downtown West (122) neighborhoods, the rates are inflated by either a very low residential population, or an influx of visitors (10s of thousands per day in the case of Downtown and Downtown West).
In the previous article we saw how much movement there was on the list when moving from the total crime index to crimes per 1,000 residents. How do these numbers change when we shift from the total crime index to property crimes per 1,000 residents? Again, we see (as we would expect by now) a lot of movement. Seven neighborhoods drop 50 places or more and nine rise at least 40 spots.

Viewing the prevalence of violent crimes, or crimes against persons (murder, rape, robbery and assault), by city neighborhood highlights the largest disparity yet between south, central and north city. Just one south city neighborhood appears in the top 27 (most violent crimes per 1,000 residents) and only four of the top 40 are located in south city. That is, of the 40 neighborhoods with the most violent crimes per 1,000 residents in the City of St. Louis, just 4 (10%) are located in south city.
The other extreme is just as stark. Not a single north side neighborhood appears among the bottom 27 (fewest violent crimes per 1,000 residents). There are just four north side neighborhoods in the bottom 40, again, just 10%. St. Louis is widely known as a city segregated by race. It is also highly segregated by violent crime.

Lastly, once again, we see the significant change on the list when moving from the total crime index to the number of violent crimes per 1,000 residents in each City of St. Louis neighborhood. Ten neighborhoods drop more than 40 spots and 10 neighborhoods climb more than 40 places. When considering crime, "crime-ridden" neighborhoods and types of crime, the questions asked and filters used significantly define our perceptions.

