
Crime and crime reporting shape our perception of St. Louis. A recent murder on a Saturday afternoon in the city's busy Central West End neighborhood has brought more attention to crime in the city. In the wake of the murder, other armed robberies were retroactively reported. Some have even noticed that not all murders are treated equally by the local press. In the first six months of 2012, there were 70 homicides reported in the City of St. Louis. The city is roughly on pace to equal the 143 homicides in 2009 and 144 in 2010, outpacing the 113 recorded last year.
The local press has taken notice of the increase in crimes committed with guns, rising number of homicides, and yes, the CWE murder (two individuals have been apprehended and charged with the crime). The mayor and St. Louis Metropolitan Police Department have held press conferences. Alderman Antonio French held an open house for the 18-camera crime surveillance center he introduced in the 21st Ward. The news coverage wasn't all favorable. "I resent @fox2now's description of my neighborhood as "crime-ridden". Both O'Fallon and Penrose have lower crime indexes than Downtown." French wrote on his Twitter account.
It seems like a good time to ask: What is the "crime index", what does it tell us about crime in our neighborhoods and is it fair to label the O'Fallon and Penrose neighborhoods (or others) as "crime-ridden"? We examined crime statistics released by the SLMPD for the first six months of 2012 and population data from the 2010 Census. Statistics cannot provide a comprehensive explanation of crime and the information here should be considered as simply one more piece of information to consider for a larger conversation regarding our city neighborhoods and relative crime and safety.
One simple, but key, takeaway is that the crime index provides a very highly distorted view of crime in our neighborhoods. In 2004 the FBI discontinued using a total crime index, the sum of eight different crimes reported in standardized form by jurisdiction across the nation. Their concern was that a raw count overemphasized larceny-thefts (almost 60 of the crimes reported) and diminished the focus on crimes against persons, such as aggravated assault, murder and rape. When you see crime rankings today, they based on these numbers. Some weight crimes, using a point scale to assign a number and ranking to neighborhoods and cities.
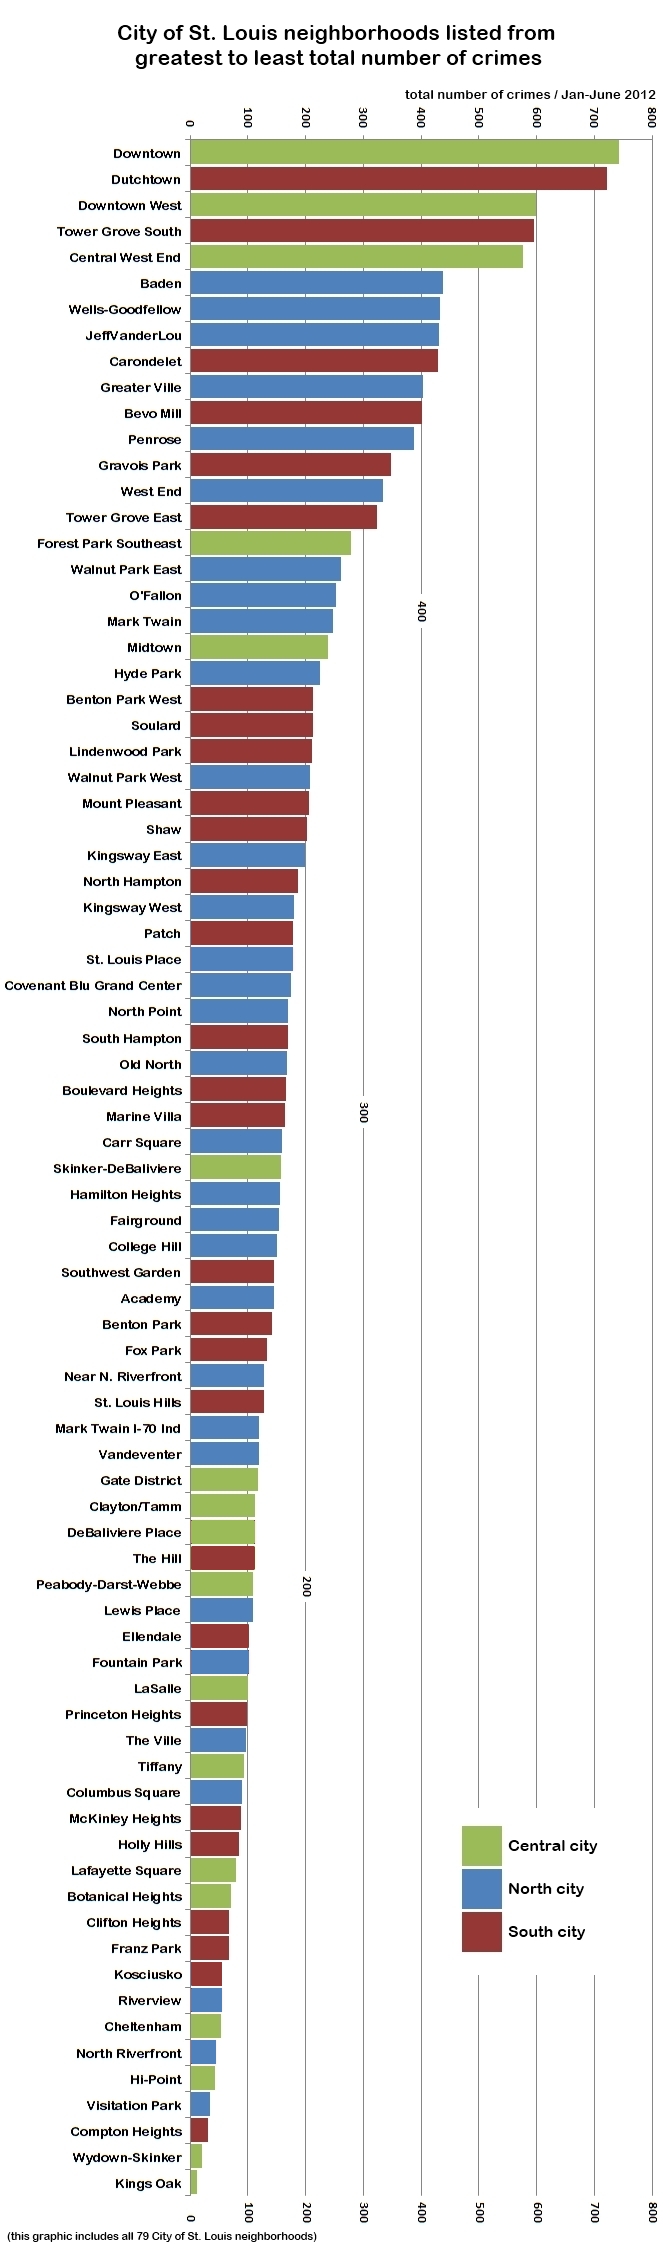
Looking at the 79 City of St. Louis neighborhoods using the simple sum of crimes reported, the crime index, we see that Downtown, Dutchtown, Downtown West, Tower Grove South and the Central West End lead. Are these the most "crime-ridden" parts of the city, to be avoided at all costs? Of course not. They sit at the top of the total crime index because they are the city's most populous neighborhoods (Dutchtown, Tower Grove South and Central West End) and the most visited (Downtown and Downtown West).

The graph shows central and south city neighborhoods at the top, followed by several north side neighborhoods, but in a broad sense, neighborhoods from across the city can be found from top to bottom. But again, the neighborhoods with the greatest number of reported crimes are also the largest neighborhoods, while the same trend can be seen in reverse with the city's smallest enclaves.
Considering the number of crimes per 1,000 residents provides more perspective. The central city Kings Oak neighborhood reported just 12 crimes counted for the crime index, but it also is home to just 180 residents. Ranked 79th by the crime index, Kings Oak rises to 20 of 79 with 67 crimes per 1,000 residents. There are other things to consider as well, such as the number of non-resident employees and visitors to city neighborhoods. When considering crimes per 1,000 residents in Koskiusko (3,929), Near North Riverfront (230), Downtown (201), Riverview (181) and Downtown West (152) neighborhoods, the rates are inflated by either a very low resident population in a large geographical area, or an influx of visitors (10s of thousands per day in the case of Downtown and Downtown West). Those five neighborhoods are excluded from the graphic below for this reason. This same affect also likely impacts Forest Park Southeast and Mark Twain/I-70 Industrial, but perhaps to a lesser extent.
Looking at the city's 79 neighborhoods by crimes per 1,000 residents, we start to see that south, central and north city neighborhoods are less mixed. South and central city neighborhoods occupy the bottom 17 spots (fewest crimes per 1,000 residents) and 22 of the bottom 23 (of 79). North and central city neighborhoods occupy 19 of the top 20 spots (most crimes per 1,000 residents), with the 14-resident south city industrial neighborhood of Koskiusko sitting far and away at the top.

How significant was the change in relative position of city neighborhoods when considering crimes per 1,000 residents instead of simply the sum of all reported crimes? The Central West End and Bevo Mill each dropped 54 places (of 79 total). The CWE may be the most surprising. Although it is generally considered safe, more than 15,000 employees and visitors to the Washington University/Barnes-Jewish Hospital medical campus enter the neighborhood daily. Lindenwood Park dropped 49 spots. Outside the industrial neighborhoods of Koskiusko, Near North Riverfront and Riverview, the small central city neighborhoods of Tiffany, Lasalle, Kings Oak and Botanical Heights climbed the most. The graphic below lists neighborhoods in order of greatest to least number of total crimes reported, with bars and numbers showing how far the neighborhood moved on the list when considering crimes per 1,000 residents.

The takeaway here is that there is an incredible amount of movement when thinking of crime in relation to the number of residents in a neighborhood. Average movement on the list was more than 24 spots. All of this was meant only to highlight perhaps the most simple, but also common abuse of crimes statistics – the total crime index. Returning to our jumping off point, was Alderman French correct? The O'Fallon (18th, 253) and Penrose (12th, 388) neighborhoods do have a much lower crime index than Downtown (1st, 743). But if it hasn't been made clear, that's probably the worst measure of crime we can use.
On the more subjective issue of whather O'Fallon and Penrose should be considered "crime-ridden"? Not by any reasonable measure. Considering crimes per 1,000 residents, Penrose is 30th of 79 – lower than many central and north side neighborhoods and five south side neighborhoods. O'Fallon, at 55th, has fewer crimes per 1,000 residents than The Hill and Tower Grove South.
Adding the measure of neighborhood population improves our understanding of crime statistics. But what about the type of crimes and our perception of safety? The FBI uniform crime report includes both crimes against people and crimes against property. In many neighborhoods, the high number of larceny-thefts skew the crime index and the number of crimes per 1,000 residents. The prevalence of particular types of crimes shape perceptions of safety. Next we'll look at how the 79 City of St. Louis neighborhoods compare when looking at crimes against people and crimes against property.
A follow-up post expands on the issues here. See: Understanding St. Louis: Total Crime Index, Violent Crimes and Property Crimes in City Neighborhoods
