

The latest round of Census estimates have been released, and while there may be few surprises, the numbers offer several narratives for Missouri and the St. Louis region.
The “hot take” for some will be that Kansas City is growing and St. Louis is shrinking. However, that doesn’t tell you very much, especially considering the vastly different nature of the city boundaries, as well as metro populations, and relative slow growth across the state.
Kansas City, MO has gained population over the past few years, adding 11,013 residents (+2.4%), per estimates. That city now counts a population of 470,800 across its 319 square miles. On the east side of the state, the St. Louis City estimate shows a loss of 3,680 residents (-1.2%) from 2010 to mid-2015 across 66 square miles. For those counting, the residential density of Kansas City is 1,475 per square mile and St. Louis, 4,783 per square mile.
Those are the numbers people are expected to care about, and the ones everyone will write about. But what’s happening in the respective metro areas, and are the numbers good news or bad news?
When the 2010 Census showed St. Louis City losing more than 29,000 residents in the first decade of the century, it was considered a disaster. This was in part because Census estimates had repeatedly been challenged by the city and stood at 354,000, a gain of about 8,000 residents. The reality of an 8% loss (348,189 to 319,294) when most were expecting the 50-year hemorrhaging of residents to have reversed, was tough to take.
But those looking for context would find similar Census misses in like cities Cincinnati and Pittsburgh, and big loses in Chicago, Detroit and Cleveland. The issue wasn’t confined to the Rust Belt. The largest discrepancy occurred in Atlanta. The 2009 estimate there was 541,000, an amazing 29.9% growth. The narrative of the booming capital of the south was in full effect.
The actual Census count in 2010 came in at 420,003, or an increase of 0.8% for Atlanta. This wasn’t suppose to happen. How could the Census, both driven by and driving the perception of population growth, have been so far off? How could Atlanta city leaders have pushed for higher estimates and believed that 30% growth was real?
City leaders want population to increase. It’s ego, it’s marketing, it’s also access to more money from federal and state grants, some of which factor in population. Atlanta challenged Census estimates and the numbers went up. Fulton County, GA, which includes Atlanta, did the same, pushing the estimate to over 1,000,000 in 2009. The 2010 Census counted 920,581 residents.
In Cincinnati, city leaders had challenged Census estimates and the number stood at 333,013 in 2009, an increase from the official 2000 population of 331,285. There was a lot to celebrate as the half century of decline was over! The 2010 Census recorded 296,943 residents. The decline continued.
That city’s 2014 estimate stood at 298,165. After consecutive decades of -10%, -15%, -9%, and -10.4% loses, any predicted population increase should clearly be considered with a healthy dose of skepticism. Cincinnati was one of very few cities that experienced an increasing rate of population loss last decade. Despite this, the narrative of Cincinnati is not predominantly one of decline.
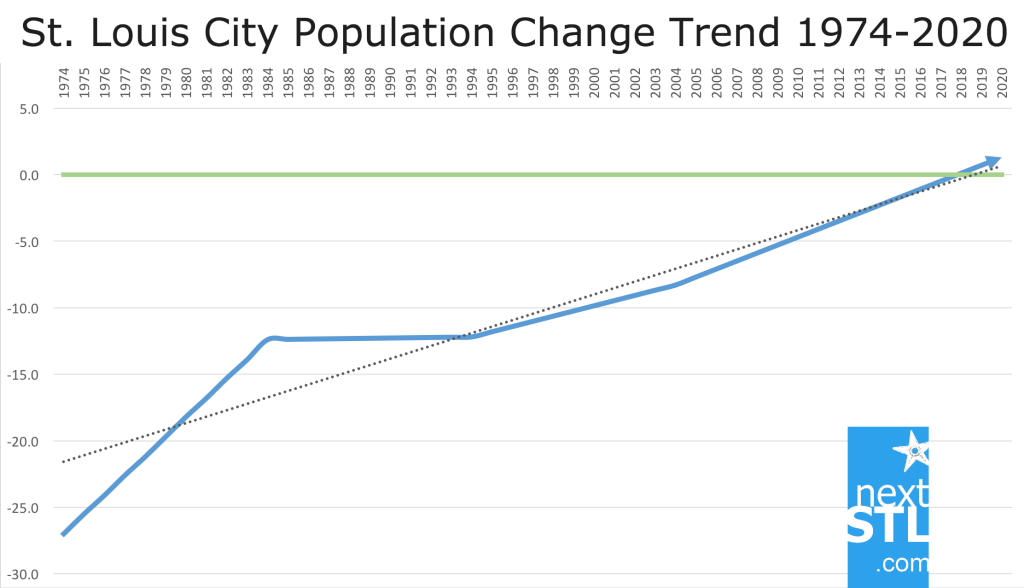
So what do the latest estimates tell us about St. Louis? The trend in St. Louis City is one of slowing loses (by decade -27%, -12.4%, -12.2%, -8.3%). The city is on pace to lose 7,360 residents, or -2.3% for the decade. And assuming the rate of decline is declining each year, if the estimate is accurate, the city may come close to holding its ground.
Further, assuming a linear change in population change rate (follow that?), the city may be gaining population by the end of the decade. In short, the change in population for a decade presumably isn’t the same for each year of that decade. Here’s what that looks like:
For the St. Louis metro area, growth remains stagnant, an estimated +24,000 residents since 2010, making it the third slowest rate of growth among the nation’s largest 25 metro areas.
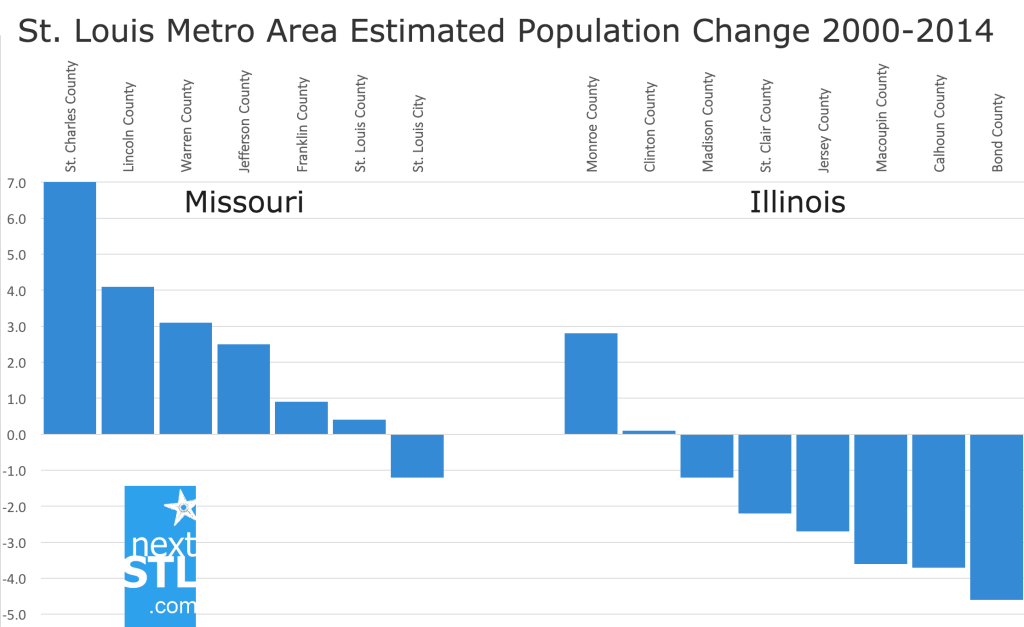
Within the metro area, however, things are anything but stagnant. St. Charles County continues to grow, but at its slowest rate in half a century. After consecutive decades of 77%, 75%, 55%, 48%, 33%, 27% growth, the county has experienced an estimated to be on pace for 14% growth this decade. With that county being increasingly built out, the rate of growth could be assumed to continue declining.
Perhaps the bigger buried lede, and I admit to burying it quite deep here, is significant population loss on the Illinois side of the metro area. Just one county (St. Louis City) is estimated to have lost population on the Missouri side of the metro area, while six of eight Illinois counties are seeing a decline in population.
What this means, among other things, is that the metro area population continues to drift further west (currently west of Clayton). In typical good news-bad news fashion, this is a positive for the state of Missouri, and a negative for downtown St. Louis, and perhaps the region.
To bring that context to a current issue, the narrative of St. Louis City’s effort to retain the National Geospatial Intelligence Agency has often been depicted as a way to stem the decline of the city, to redevelop an area that is losing population. St. Clair County, the city’s rival for the $1.6B project, lost 2.2% of its population so far this decade, nearly double the rate of loss estimated for the city.
Often, the stories we tell, the narratives we craft, or submit to, are more powerful than reality. Numbers have value, there’s a big incentive to inflate them, and perhaps a natural tendency to want to believe positive news. We deny evidence counter to our accepted narrative.
St. Louis County is losing population? That’s a blip, we’re growing again. St. Charles County continues to boom (though at an ever-slower pace). Residents continue to flee the city (though at an ever-slower pace). The metro east is a bucolic wonderful place to live (and is losing population quickly). In the end, trends continue until they don’t.
Current estimates appear to make more sense than those of last decade, and St. Louis, and other cities, are not challenging the numbers this time around. Yet side variations last time around can’t be fully accounted for by politicians hoping to boost their city’s image. Only another five years will reveal the real numbers.
For a national perspective on trends in population change, check out this comprehensive read at City Lab: 2015 U.S. Population Winners: The Suburbs and the Sunbelt
