Most Americans seem to intuitively understand that demographic composition of American metropolitan areas is fundamentally changing in ways not seen since the post World War II era. Now there’s statistical evidence to back up this assertion.
I pulled together the race and ethnicity data for the twenty largest urbanized areas in the U.S., as identified in the 2010 Census, and analyzed changes in their demographic patterns between the 2010 Census and the 2014 American Community Survey one-year estimate data. The 2014 ACS data was released in mid-September, and sparked some interesting initial analysis. I wanted to dig a little deeper.
Within the twenty largest urbanized areas (note: urbanized areas are contiguous census tracts of development than have at least 1,000 inhabitants per square mile, and are usually smaller than metropolitan statistical areas, which usually conform with county boundaries), which are major urban centers with 2 million or more in population, I found the following:
Nationally, principal cities and their suburbs both grew at 4.4% between 2010 and 2014. This runs counter to the decades-long trend of suburban growth significantly outpacing principal city growth. However, growth in both cities and suburbs masks trends that become evident when looking at growth at the race and ethnicity level, both nationally and within urban areas.
Metro area population growth is driven by strong growth among Hispanics, Asians and other groups. Together, Hispanics, Asians and other groups, here identified as Native Americans, Pacific Islanders and those identifying as mixed race, grew by more than 10 percent between 2010 and 2014. The growth rate for each group is double or triple the overall growth rate, and is apparent in both principal cities and suburban areas..
Within urbanized areas, however, whites and blacks are growing at much slower rates – blacks at 4.0%, whites at just 0.3% nationwide. The slower rates of growth mask more profound changes taking place, described below.
Within the twenty largest urbanized areas, the number of white residents is growing in principal cities and decreasing in suburbs. While the number of whites in the twenty largest urbanized areas has remained essentially flat at 0.3%, the number within principal cities grew by 3.0% while dropping by 0.4% in suburban areas.
Similarly, the number of black residents in growing in suburbs, and essentially flat in principal cities. The number of blacks within the twenty largest urbanized areas grew by 4.0%. However, within principal cities the rate of growth was flat at 0.1%, while very robust at 7.1% in suburban areas.
At the metro level, 12 of the top 20 metro areas have principal cities where the white population is increasing while the black population is decreasing, or where the growth rate of whites exceeds that of blacks. Many of the cities well known for having substantial gentrification activity are included in this group, but not exclusively so; it also includes cities where gentrification might be less of a story than in other places.
Similarly, 19 of the top 20 metro areas have suburbs where the black population is increasing while the white population is decreasing, or where the growth rate of whites exceeds that of whites. Los Angeles is the only urbanized area that deviates from this pattern, showing a decline in the number of whites and blacks within suburban areas.
In a nutshell, Hispanics, Asians and other groups show robust growth in the cities and suburbs of our largest urban areas. The growth rate of whites is essentially flat, but declining in suburbs and growing in cities. The growth rate of blacks is moderate, but flat in cities and accelerating in suburbs.
If these trends hold or accelerate, it could mean the nation is witnessing its most significant domestic migration reordering in decades. It could potentially rival the four major domestic migration shifts in American history — the rural-to-urban shift that birthed our major cities; the Great Migration, which similarly brought millions of rural Southern blacks to Northern cities; the post-WWII suburbanization, and the Rust Belt-to-Sun Belt transition that saw the growth of numerous Southern and Western metro areas.
These findings are perhaps better understood when visualized. This first chart shows national patterns by race and ethnic group:
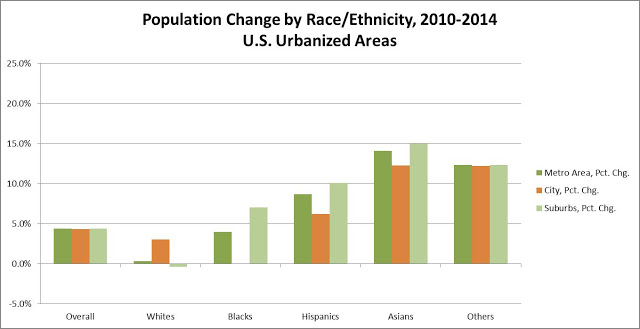
On the whole, the top twenty urbanized areas contained 102 million people in 2010, and added another 4.3 million by 2014. As you can see on the far left, the distribution was equal between city and suburb. For Hispanics, Asians and other non-black minorities, city and suburban growth was strong in cities and suburbs. The following chart hones in on whites and blacks:
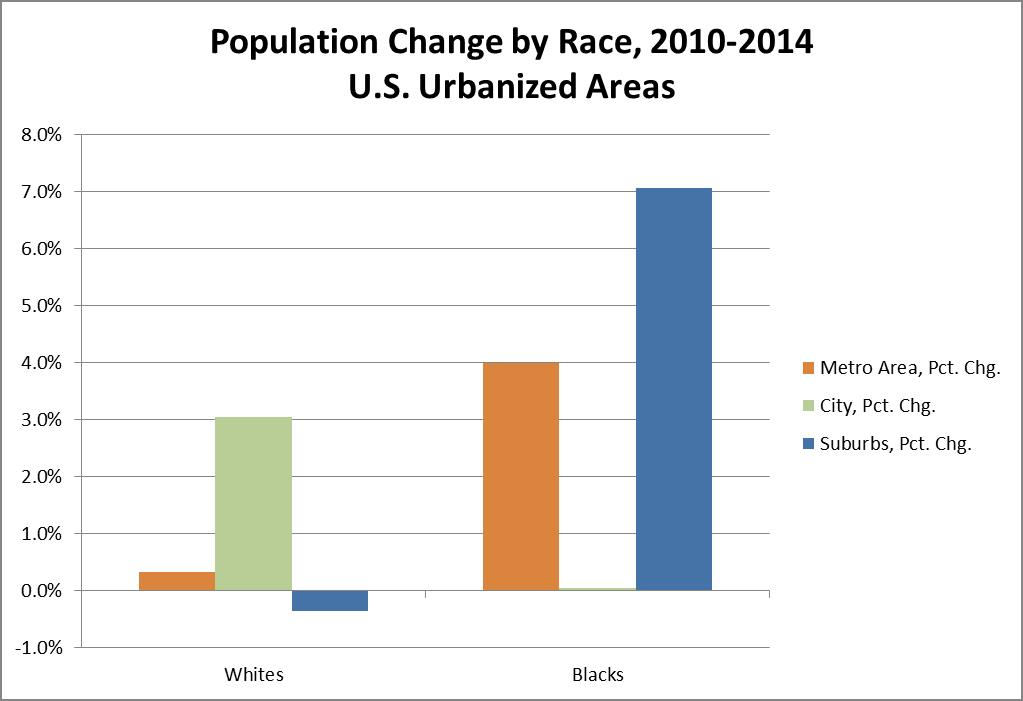
The growth rate of whites in principal cities (3.0%) is thirty times that of blacks in the same geography (0.1%). Meanwhile, black suburban growth came in at 7.1%, while the number of whites in suburbs declined by 0.4%.
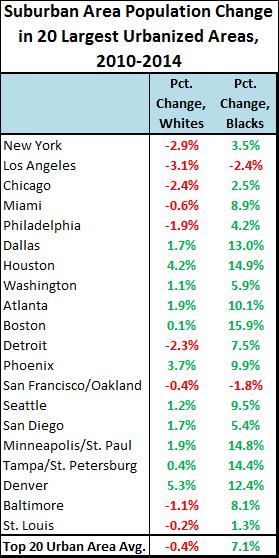
Here’s how the change in principal cities looked individually (note: in instances of dual principal cities — San Francisco/Oakland, Minneapolis/St. Paul, and Tampa/St. Petersburg — I grouped the principal cities together). Below is also similar table that compares numbers in suburban areas:
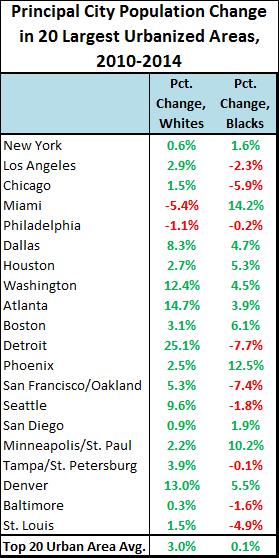
City population growth among whites is almost uniformly positive, with 18 of 20 principal cities making gains. Detroit, Atlanta, Denver and Washington, DC each made double-digit percentage gains. Only Miami and Philadelphia show losses. Meanwhile, nine of 20 principal cities lost black residents, led by Detroit (-7.7%), San Francisco/Oakland (-7.4%), and Chicago (-5.9%). Only six of the 20 principal cities, New York, Houston, Boston, Phoenix, San Diego and Minneapolis/St. Paul, show stronger gains in black population growth compared to whites.
Nine of the 20 suburban areas of urbanized areas actually lost white residents. Those losing the most were Los Angeles (-3.1%), New York (-2.9%), and Chicago (-2.4%). On the other hand, only two of 20 suburban areas lost black residents (Los Angeles and San Francisco/Oakland), with seven (Dallas, Houston, Atlanta, Boston, Minneapolis/St. Paul, Tampa/St. Petersburg and Denver) showing strong double-digit suburban gains. Suburban Phoenix and Seattle were not very far behind in terms of black suburban growth.
The maps below show how this looks geographically. First, principal cities:
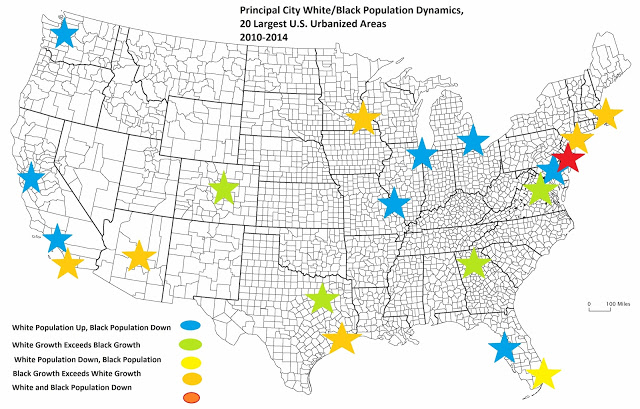
It’s hard to make any sort of geographic assumptions here, but one could argue the white-city/black-suburb shift is most pronounced in the Rust Belt and the West Coast. It could be that strong pull factors minimize the impact in some of the major Northeastern metro areas, and smaller numbers of blacks in West Coast cities might overstate the shift. However, the suburban map is pretty strong in its findings:
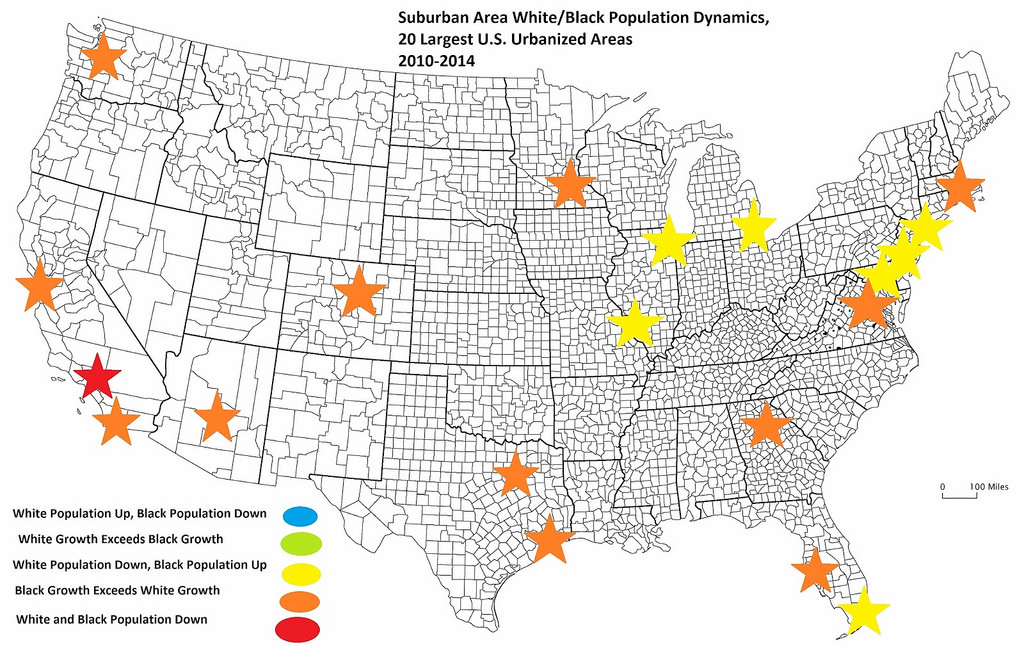
Compared to whites, blacks are undeniably suburbanizing across the nation.
There are many caveats that apply to this analysis. First among them is that this analysis covers a short, 5-year time horizon, in the aftermath of our nation’s greatest economic collapse since the Great Depression, and its effects could still impact us today. This analysis also covers only the twenty largest urbanized areas; while they do contain nearly a third of the U.S. population, looking at more areas could mean more nuance to the data. There’s also the matter of using urbanized areas versus metropolitan statistical areas as the unit of analysis. It could be argued that many exurban edges of metropolitan areas are not included, leaving out considerable low-density, semi-urban areas that are part of metropolitan areas. Lastly, there could be any number of factors that contribute to population change that are not included in the analysis — differences in birth and death rates between racial and ethnic groups being chief among them. Further analysis is necessary.
But that does not mean that these early findings are not significant. In some ways, this is evidence of something I once called the Great Congealing, whereby cities and suburbs begin to look more alike than different in terms of their demographics, built environment, infrastructure, and economy. It stands as evidence that after decades of barriers put in place, both explicit and implicit, to limit minority suburban growth, the barriers are slowly eroding. That should be viewed as a positive.
However, there may be unintended impacts stemming from this migrational shift. For example, for a generation now urbanists have been building a case for the impracticability of suburbs as they exist now, and many may now be voting with their feet to move into cities. As they move in, jobs, amenities, and resources to strengthen infrastructure may follow them. Will a new minority-laden suburbia have the ability to demand the improvements necessary to keep them viable?
[slideshow_deploy id=’192918′]
(slideshow added by nextSTL, via Mapping Decline: St. Louis and the American City)
*this post first appeared on Pete’s excellent blog The Corner Side Yard and is reposted here with the author’s permission.
We reposted this item as it hits home in a place like St. Louis. In addition to events in Ferguson, Missouri, and the attention paid to changing demographics in suburban St. Louis municipalities, the film Spanish Lake gave the issue the feature film treatment. And now, as the rate of loss of St. Louis City residents slows, we are experiencing for the first time, an influx of young, educated, and mostly white residents, while the exodus of black residents continues. More reading on nextSTL:
Spanish Lake Film Review: Disposable Communities and Suburban Development
Millennials are Saving St. Louis, and Why We Need More of Them
Colin Gordon Talks Mapping Decline, Vacant Land and Urban Renewal With nextSTL
Exodus Continues: St. Louis Loses 29K Residents 2000-2010
Understanding Population Change and Density in St. Louis (UIC & nextSTL @ PXSTL)
