Recently, nextSTL has looked at the total crime index and crime-ridden neighborhoods as well as violent crimes and property crimes per 1,000 residents in the 79 City of St. Louis neighborhoods. If the analysis showed anything, it was that a) the total crime index is nearly worthless as a tool to understand crime in the city, and b) considering crimes per 1,000 residents, and pervalence of violent crime and property crime provides a much more clear understanding of crime in our city. There remain significant caveats, most significantly, neighborhoods with a significant influx of workers or visitors appear to have a higher prevalence of crime because only residential numbers were used.
Recently, the city has announced a possibly influx of $600,000 to help address crime in the city. This has come with the expected, but still unfortunate local news headlines, such as, "St. Louis officials re-doubling anti-crime efforts." Beyond the headlines, the effort is important and significant. In short, as a trial effort, dozens of officers are being taken off their day shifts and moved to nights for a period of 30 days. St. Louis Police Chief Dan Isom was quoted as saying, "These officers are patrolling very well defined areas where we believe we have the most chance, the most probability of preventing homicides or shootings." The experiment has reportedly already shown positive results. The first weekend of implementation saw two shootings and no homicides in the city, as opposed to 10 shootings and two homicides the prior weekend.
The announcement stated that the new effort would be focused on 12 city neighborhoods: two in south city, two in the central city and eight in north city. The local news stated that these 12 are "where the majority of crimes occur." The 12 neighborhoods are: Gravois Park and "Upper Dutchtown" in south city, "Central Downtown" and the Central West End in the central city and Carr Square, College Hill, Greater Ville, Hamilton Heights, Kingsway East, Penrose, Walnut Park East, Walnut Park West and the West End in north city.
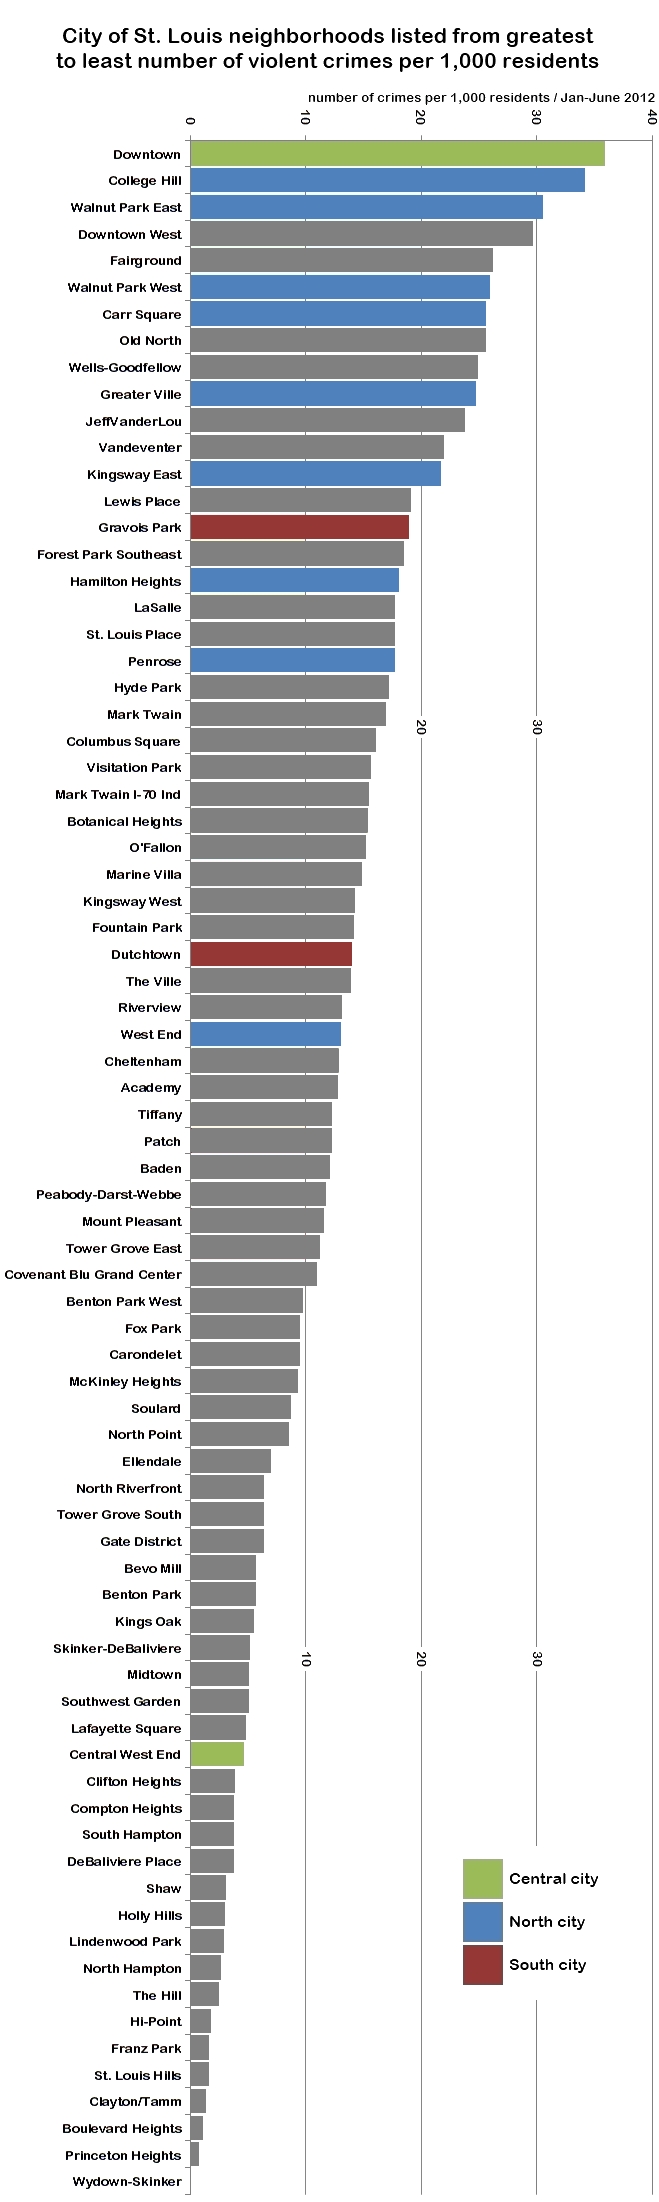
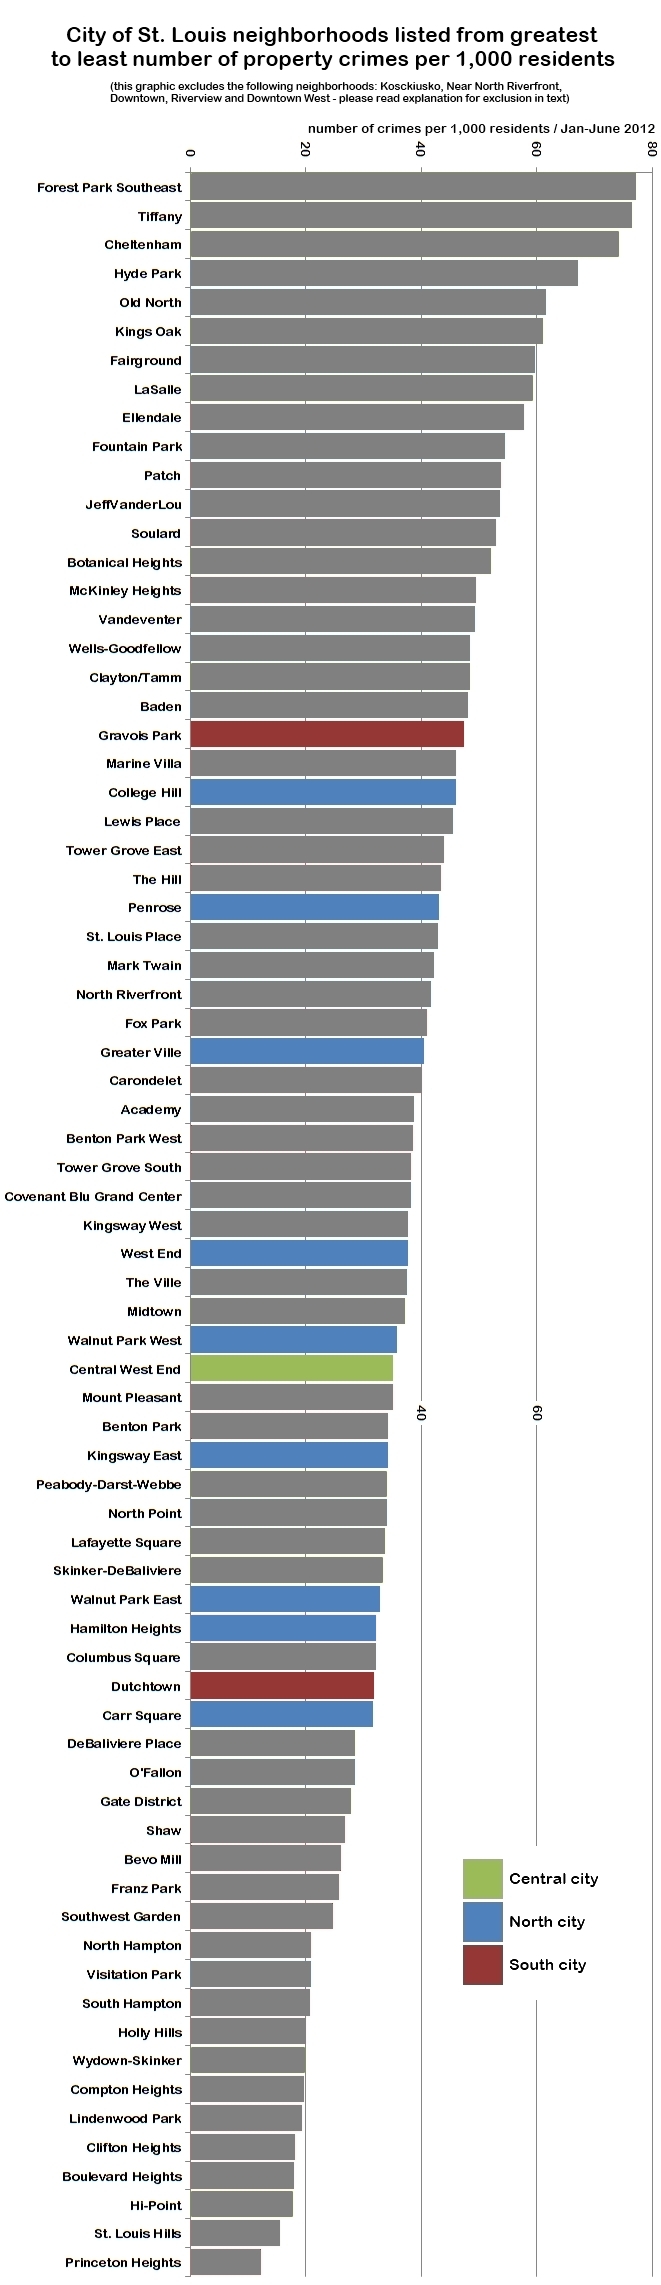
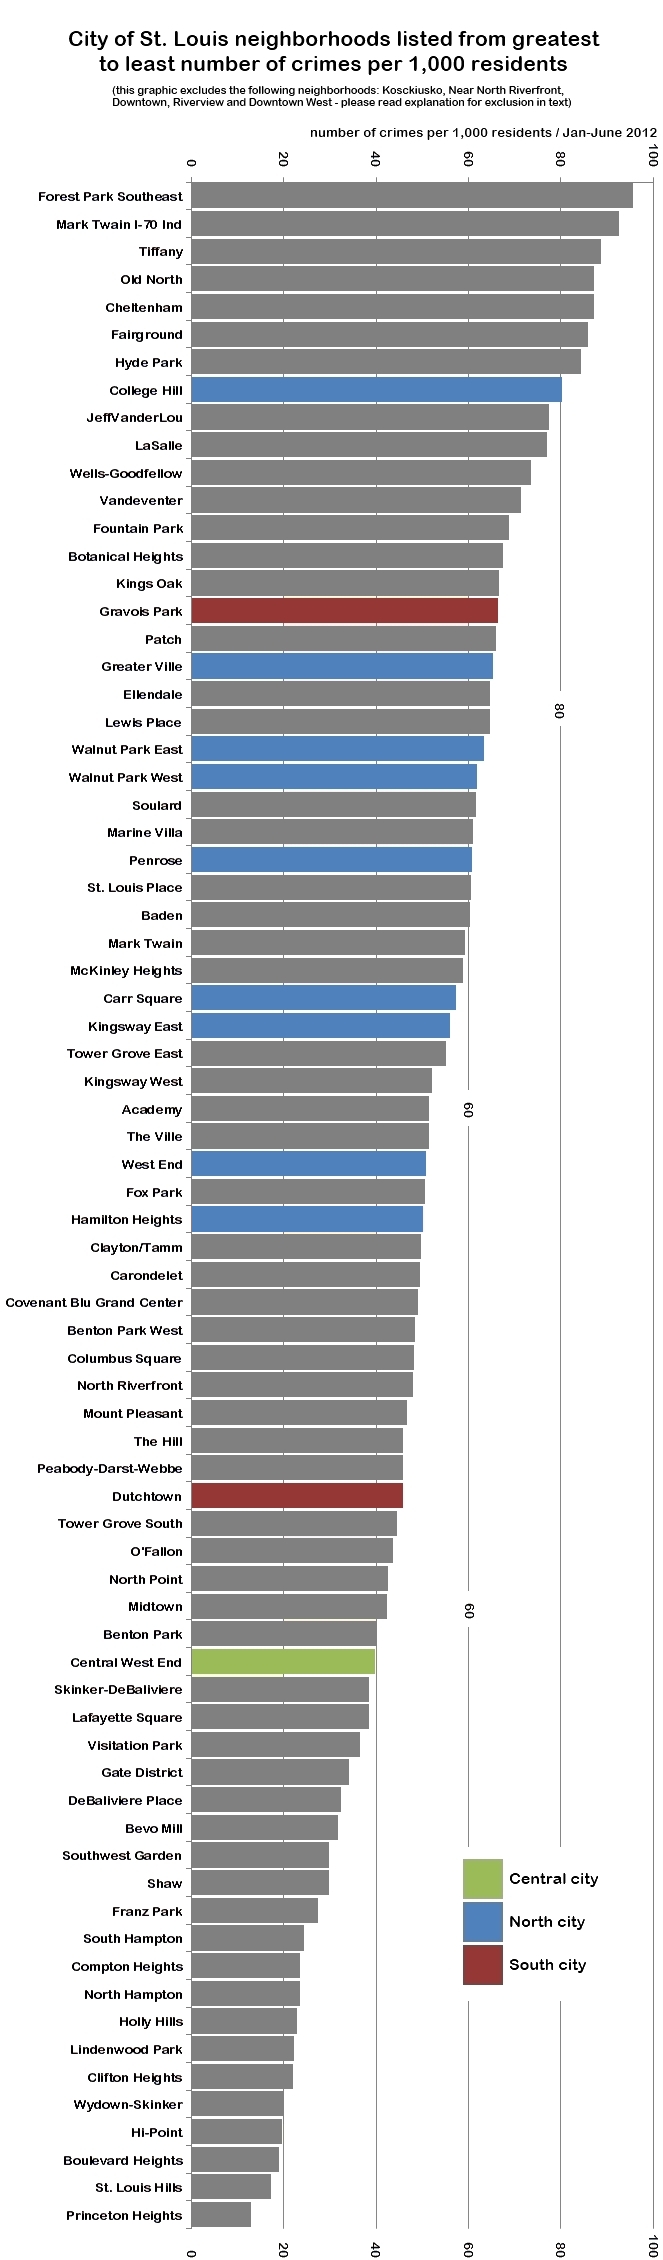
There is too much crime in each of these 12 neighborhoods, but how much? Are the 12 where the majority of crimes occur, as reported? The graphics below were adpated from the previous nextSTL articles linked to above. They show which neighborhoods are the focus of the new 30-day effort (in color), while other neighborhoods are shown in gray. A quick glance shows that, indeed, the effort is focused on those neighborhoods with the most violent crime, while looking at property crime shows how neighborhoods defy a simplistic "where the majority of crimes occur" label.
The West End is a bit of an outlier, though the announcement grouped it with Hamilton Heights. Gravois Park and Dutchtown are among the most violent south city neighborhoods, but have many fewer violent crimes per 1,000 residents than several north city neighborhoods not included in this effort. Penrose is one of the 12 as well, though 19 neighborhoods have reported a higher rate of violent crime. The Central West End is the most significant outlier at 63 of 79 when considering violent crimes per 1,000 residents.
Notes: 13 neighborhoods appear in two of the graphics below as the West End and Hamilton Heights are shown independently. Downtown is used to represent "Central Downtown" and Dutchtown is used to represent "Upper Dutchtown".)
Neighborhoods appearing in color comprise the 12 targeted in the 30-day anti-crime effort.