-1.JPG) The St. Louis, MO/IL metropolitan area hasn’t made the CQ Press “most dangerous” list since 2010. Why? It’s unclear, but likely a result of the region not producing uniform crime reporting statistics. But the City of St. Louis continues to get ink as the second most dangerous city in the nation (after Detroit). This ranking applies to a geographic area that is home to 11.3% of the metro population.
The St. Louis, MO/IL metropolitan area hasn’t made the CQ Press “most dangerous” list since 2010. Why? It’s unclear, but likely a result of the region not producing uniform crime reporting statistics. But the City of St. Louis continues to get ink as the second most dangerous city in the nation (after Detroit). This ranking applies to a geographic area that is home to 11.3% of the metro population.
Pointing out that a significant majority of crime in the city occurs in just a handful of neighborhoods has proved to be something of a political liability, but it remains true that many city neighborhoods have less crime than some inner ring suburbs. At nextSTL we have covered the issue of crime statistics extensively, the latest being Understanding St. Louis: Total Crime Index and Crime-Ridden Neighborhoods and Total Crime Index, Violent Crimes and Property Crimes in City Neighborhoods. The point isn’t to validate or invalidate any particular report, but to gain context and a better understanding of what crime statistics tell us and what they don’t tell us.
What do the crime rankings tell us? What does it mean that the City of St. Louis ranks second while Indianapolis is 28th, far enough down the list to avoid all the Top 10 lists and negative press? What does it mean that when considering metropolitan areas that St. Louis is 103rd while Indianapolis is 38th (2009 – the last year each were listed)?
First, suburban Indianapolis could be especially dangerous, particularly when compared to suburban St. Louis, accounting for the flip when moving from city to metro area rankings. But does this seem plausible? No, for several reasons. In Indianapolis, the suburbs are truly suburbs as the city encompasses 372 square miles, with the central business district at the center of the square shaped city (the city and Marion County consolidated in 1970). These young surburbs are unlikely to be hotbeds for crime. Indianapolis accounts for 47.2% of the population of its metro region.
The more logical explanation is much more simple. The City of St. Louis is just 62 square miles, encompassing the oldest parts of the urbanized metro area. The median age of a home in the city is 59 years. In Indianapolis that number is 34 years. Indy is a younger city, but that number is drastically different because Indianapolis includes newer residential areas that would suburbs in St. Louis, both inner ring (Webster Groves, Clayton) and even suburbs west of I-270.
So, very simply, Indianapolis and St. Louis vary greatly because comparing city-to-city crime statistics is apples-to-oranges. One is a small segment of the metro area population that includes the oldest, most urban part of the region, the majority of which was developed by 1910. The other captures a very large swath of the metro area, including diverse development patterns and ages.
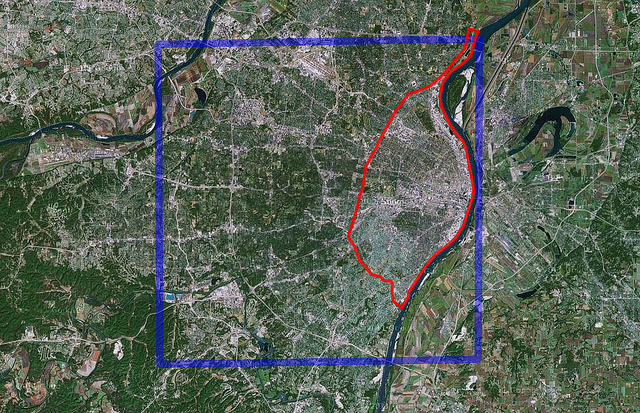
Where would the City of St. Louis rank is measured by the same area as Indianapolis? That’s hard to say, exactly, as one would need to compile crime statistics from the city, county and most of its 90 municipalities, but the metro area ranking gives us an idea. Without that measurement, just looking at a map makes it clear how drastically things would change. Communities from Clayton to Creve Coeur, Maryland Heights to Town & Country to Sunset Hills would be added to produce the ranking, dropping St. Louis far down the list.

{land area of the City of Indianapolis in blue superimposed on the St. Louis region – City of St. Louis boundary in red (roughly centered on region’s population center)}
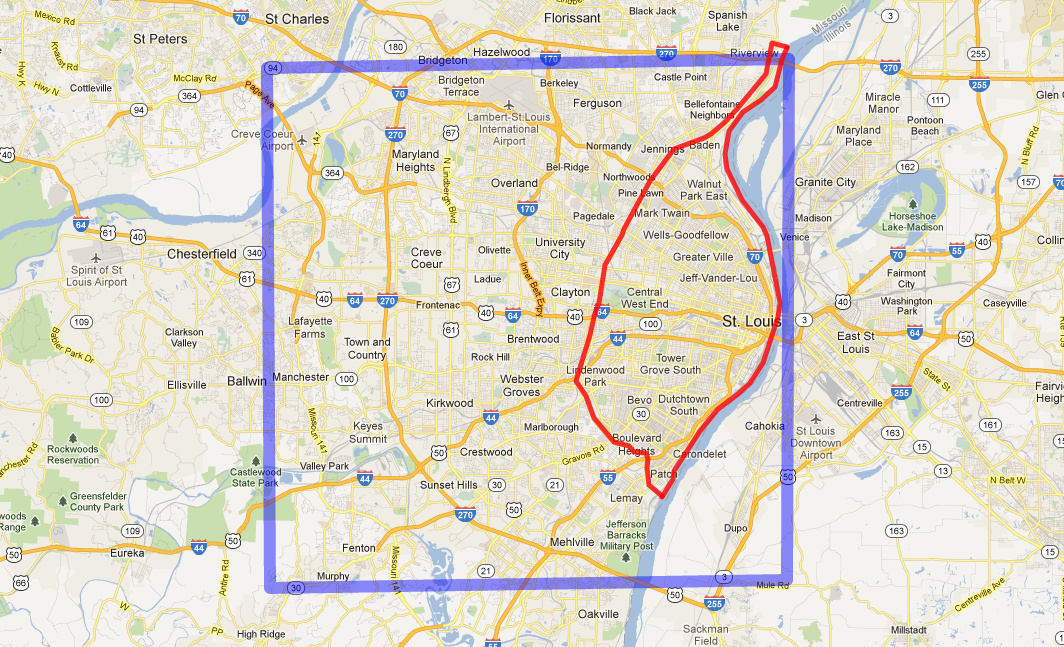
{land area of the City of Indianapolis in blue superimposed on the St. Louis region – City of St. Louis boundary in red}
The Indianapolis city crime ranking includes significant suburban development. The City of St. Louis does not. Comparing metro areas is apples-to-apples because they use the same geographic boundary measurments, resulting in a much more clear comparison than that of city-to-city comparisons. That said, residents of any city live on a block and in a neighborhood. The measurement of crime at that level is what we experience each day and what matters most in our lives and why nextSTL recently examined crime statistics for each of the 79 neighborhoods in St. Louis.
From the 2009 Metropolitan Crime Rate Rankings: According to CQ Press, the St. Louis area is the 103rd most dangerous in the nation. That would make St. Louis less dangerous than New Orleans, Orlando, San Francisco, Anchorage, Houston, Philadelphia, San Antonio, Nashville, Atlanta and 93 other metropolitan areas in the U.S.
I’ve been lucky enough to visit Memphis, Las Vegas, Miami, Battle Creek-MI, South Bend-IN, Toledo and Dover, among other cities on the list, and have spent a lot of time in Indianapolis (#38). I never felt particularly unsafe in any of these, but maybe I should have. When I pass through these and others cities now, I can be thankful that it’s only a visit and that I will soon return to a safer life in St. Louis. (Top 110 Most Dangerous Metropolitan Regions below)
The 110 Most Dangerous Metropolitan Regions – CQ Press (PDF)
1 Pine Bluff, AR 152.78
2 Memphis, TN-MS-AR 119.55
3 Saginaw, MI 86.68
4 Miami-Dade County, FL M.D. 79.24
5 New Orleans, LA 78.94
6 Florence, SC 78.73
7 Las Vegas-Paradise, NV 76.35
8 Albuquerque, NM 75.15
9 Fayetteville, NC 70.03
10 Oakland-Fremont, CA M.D. 67.94
11 Columbus, GA-AL 67.92
12 Little Rock, AR 63.34
13 Jackson, TN 62.16
14 Flint, MI 61.30
15 Stockton, CA 59.13
16 Lawton, OK 57.17
17 Shreveport-Bossier City, LA 57.00
18 Orlando, FL 55.30
19 Jacksonville, FL 54.49
20 Mobile, AL 53.54
21 Birmingham-Hoover, AL 50.97
22 Sumter, SC 49.39
23 Miami (greater), FL 49.08
24 San Francisco (greater), CA 47.56
25 Macon, GA 47.45
26 Tallahassee, FL 47.40
27 Jackson, MS 46.86
28 Hot Springs, AR 46.37
29 Tucson, AZ 45.62
30 Anchorage, AK 44.49
31 Baltimore-Towson, MD 43.68
32 Charlotte-Gastonia, NC-SC 43.38
33 Yakima, WA 42.45
34 Bakersfield, CA 40.53
35 Charleston-North Charleston, SC 40.15
36 Houston, TX 40.06
37 Modesto, CA 39.06
38 Indianapolis, IN 39.01
39 Waco, TX 37.95
40 Longview, TX 37.78
41 Salisbury, MD 37.21
42 Tulsa, OK 37.06
43 Spartanburg, SC 37.01
44 Visalia-Porterville, CA 36.67
45 Philadelphia, PA M.D. 36.65
46 Battle Creek, MI 36.14
47 Laredo, TX 35.87
48 Vallejo-Fairfield, CA 35.67
49 West Palm Beach, FL M.D. 35.51
50 Amarillo, TX 34.32
51 Oklahoma City, OK 33.88
52 San Antonio, TX 33.64
53 Lima, OH 31.96
54 Lubbock, TX 31.54
55 Columbus, OH 30.66
56 Los Angeles County, CA M.D. 30.33
57 Columbia, SC 30.14
58 Lafayette, LA 29.94
59 Texarkana, TX-Texarkana, AR 29.39
60 Panama City-Lynn Haven, FL 29.05
61 Gainesville, FL 28.84
62 Winston-Salem, NC 28.76
63 Corpus Christi, TX 28.20
64 Tuscaloosa, AL 28.15
65 Wichita, KS 27.44
66 Merced, CA 27.20
67 Savannah, GA 26.78
68 Wilmington, DE-MD-NJ M.D. 26.74
69 Nashville-Davidson, TN 25.70
70 Atlanta, GA 25.68
71 Greensboro-High Point, NC 25.35
72 Tampa-St Petersburg, FL 25.22
73 Philadelphia (greater) PA-NJ-MD-DE 24.62
74 Phoenix-Mesa-Scottsdale, AZ 23.89
75 Dover, DE 23.66
76 Goldsboro, NC 23.27
77 Fresno, CA 22.15
78 Durham-Chapel Hill, NC 22.05
79 Santa Fe, NM 21.33
80 Beaumont-Port Arthur, TX 20.15
81 Dallas-Plano-Irving, TX M.D. 19.78
82 Auburn, AL 19.34
83 San Francisco-S. Mateo, CA M.D. 18.82
84 Vineland, NJ 18.78
85 Salinas, CA 18.47
86 Greenville, NC 18.46
87 Fort Lauderdale, FL M.D. 17.86
88 Toledo, OH 17.82
89 Redding, CA 17.79
90 Sacramento, CA 16.57
91 Rapid City, SD 16.40
92 Wichita Falls, TX 15.94
93 South Bend-Mishawaka, IN-MI 15.22
94 Dallas (greater), TX 15.21
95 Lakeland, FL 15.17
96 Washington, DC-VA-MD-WV M.D. 14.63
97 Pensacola, FL 13.71
98 Jonesboro, AR 13.54
99 Ocala, FL 13.43
100 Los Angeles (greater), CA 13.13
101 Montgomery, AL 12.08
102 Palm Bay-Melbourne, FL 11.13
103 St. Louis, MO-IL 11.10
104 Knoxville, TN 10.99
105 San Angelo, TX 10.51
106 Milwaukee, WI 10.28
107 Colorado Springs, CO 10.24
108 College Station-Bryan, TX 9.90
109 Bradenton-Sarasota, FL 9.52
110 Cape Coral-Fort Myers, FL 8.05
