Today, the Board of Aldermen for the City of St. Louis is expected to release their initial draft map of a new ward map, which will go into effect for the next round of municipal elections in 2023. The release is coming in advance of an initial round of public input hearings over the next several weeks, set up to garner feedback from the residents of the City and allow the Board to take that feedback and use it to inform any adjustments to the draft map which they may choose to make.
The process that the Board is currently undertaking is mandated to occur after each decennial census by the city charter. However, the process this round is slightly more complex. Not only are ward boundaries needing to be shifted to keep up with population shifts, but in accordance with a change to the number of aldermen that voters passed in 2012 after numerous attempts to do so were defeated. The board will be cut from 28 to 14 ward representing aldermen, plus the President of the Board, at the next election. This redistricting process therefore offers an opportunity not to just shift ward boundaries, but to completely re-imagine how the communities that will eventually make up these new wards are grouped together, and why.
NextSTL – 2012 – Dependent Personality Disorder and the Looming Failure of Political Reform in St. Louis
NextSTL – 2012 – Yes on Prop R: Why Passing Political Reform is Important to the Future of St. Louis
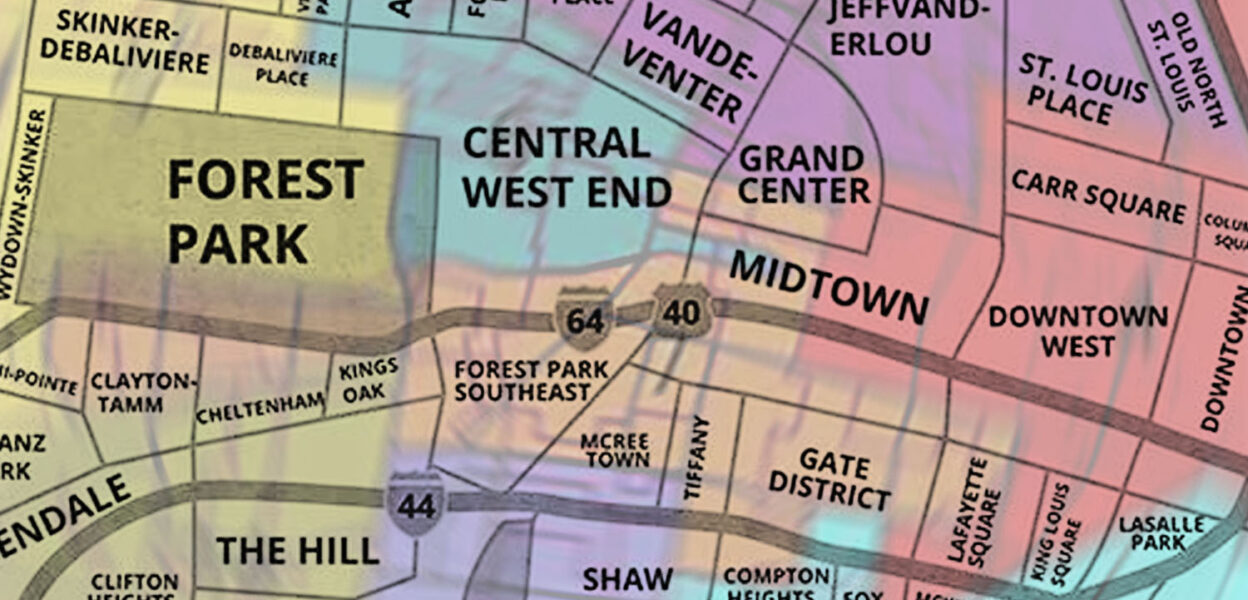
A stated goal of President Reed and Alderman Vollmer (who chairs the Legislation Committee responsible for producing the new ward map) is that these new wards keep as many neighborhoods and “communities of interest” as possible from being split between two or more wards. Broadly speaking, in a city that is overwhelmingly Democratic-leaning in every level of elective politics, these new wards are not likely to be competitive on a partisan basis. There are however several other measures of a “fair” ward that the board may measure itself by.
Among these other measures is “compactness”, or how tightly grouped the geographies that compose a certain ward are. Traditionally, the compactness of various wards has taken a backseat to the needs of having balanced populations in each ward, as well as a certain degree of power preservation amongst aldermen, and in some cases political party central committee members. The latter is how we end up with wards looking like the current 7th and 9th Wards.
Another measure of fairness commonly utilized when drawing up new political boundaries in communities which are not heterogeneous is the number of districts which are majority minority. In a city like St. Louis, with very stark racial segregation, in both geographic and economic terms, to name a few, it is difficult to draw ward boundaries in a way that does not end up with very homogeneous intra-ward demographics. Not impossible, especially parts of the central corridor and some nearby areas, but still difficult.
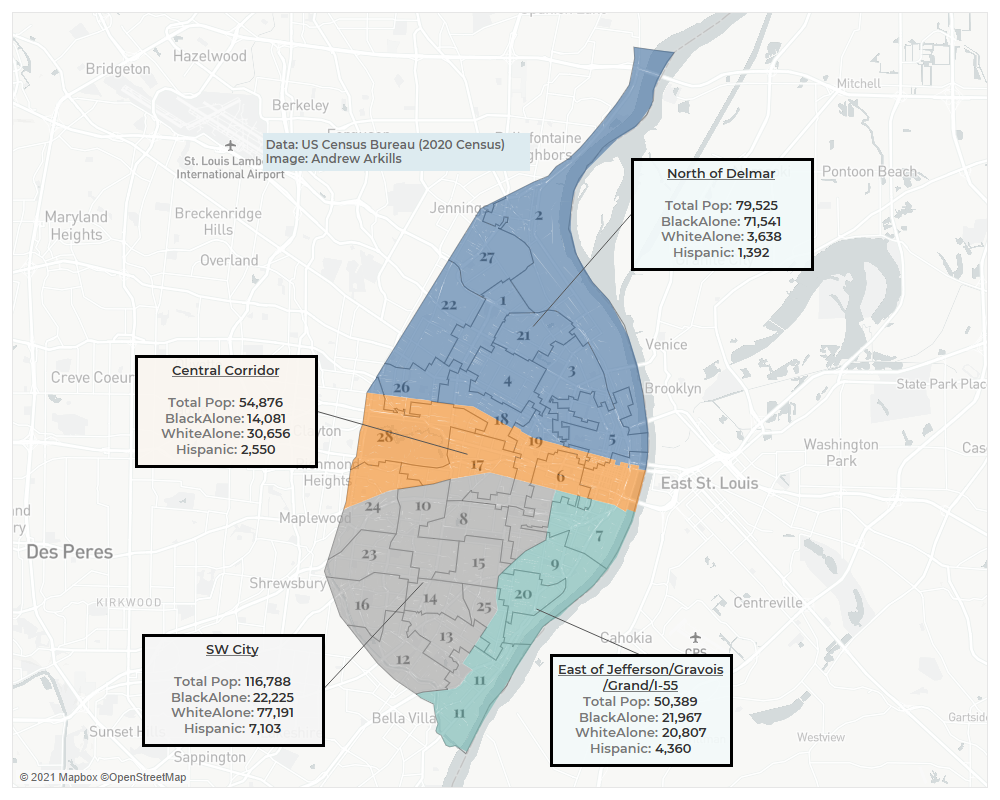
As a self-described hobbyist in the area of spatial data analytics, I like to keep my finger on the pulse of the ways in which the city we call home is constantly shifting and changing around us, so in that vein, I found several aspects of the 2020 Census data release pretty interesting. I made the map below to confirm several hunches I had about the changing demographic picture in the decade since the 2010 census. The most immediate observation is that the continued neglect and disinvestment by the City and region in North City has continued to have disastrous results, from a population growth perspective. as of the taking of the 2020 Census, there was only a little over one quarter of the City’s population living north of Delmar. The second observation is that, if one is willing to rework some long-standing mental models of the racial geography of the City, there are actually two areas of the city which are at least plurality Black. These areas are the part of the City north of Delmar, and the part of the City east of a line moving southeast from downtown and following Jefferson, then Gravois, then Grand, and finally I-55 until the southern city limit is reached. On a population-only basis, the new wards must be roughly equal, and under the 2020 census figures, this equates to around 22,000 per ward. On that basis, hypothetically, there are ways in which those two areas could be apportioned to be the primary building blocks for at least five majority black wards, if not more.
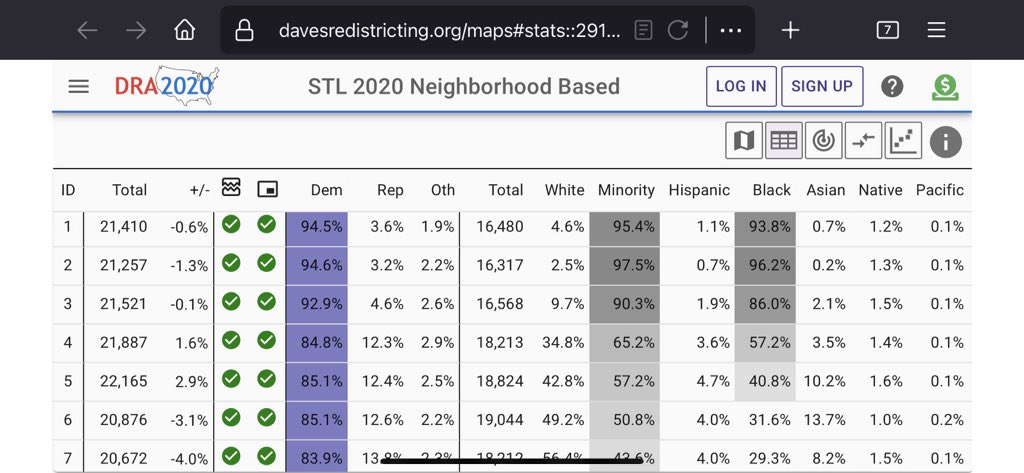
The next step in my data exploration involved the use of a freely available tool called Dave’s Redistricting. This tool pulls in both census demographics, as well as recent election results to allow the public to check legislator-drawn maps for measures of fairness. In addition to that functionality, it allows users to use the building blocks of legislative districts, census blocks, to build out their own maps and analyze the results of those hypothetical redistricting efforts.
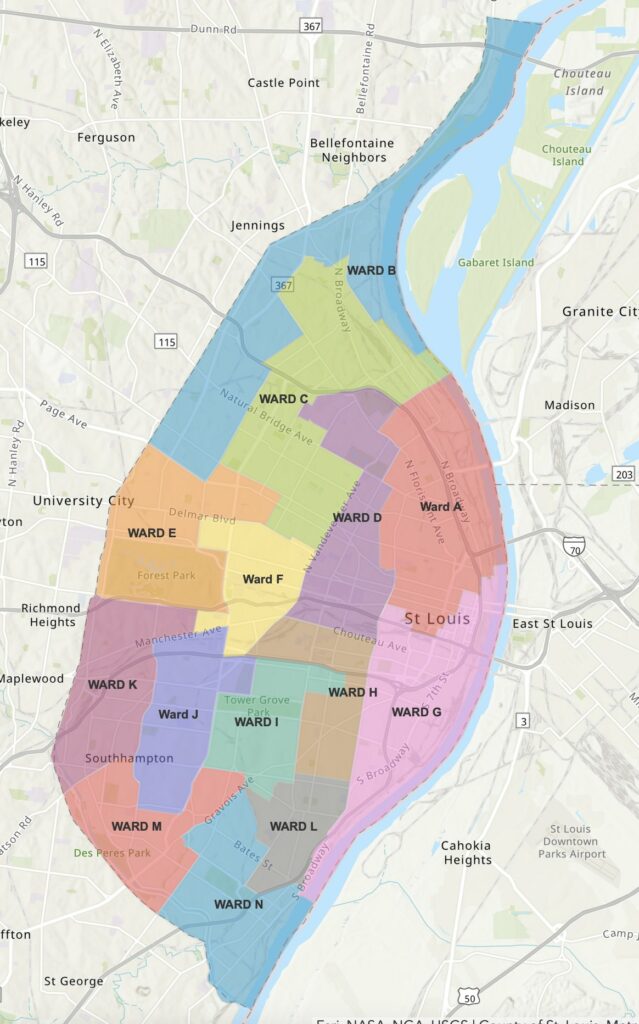
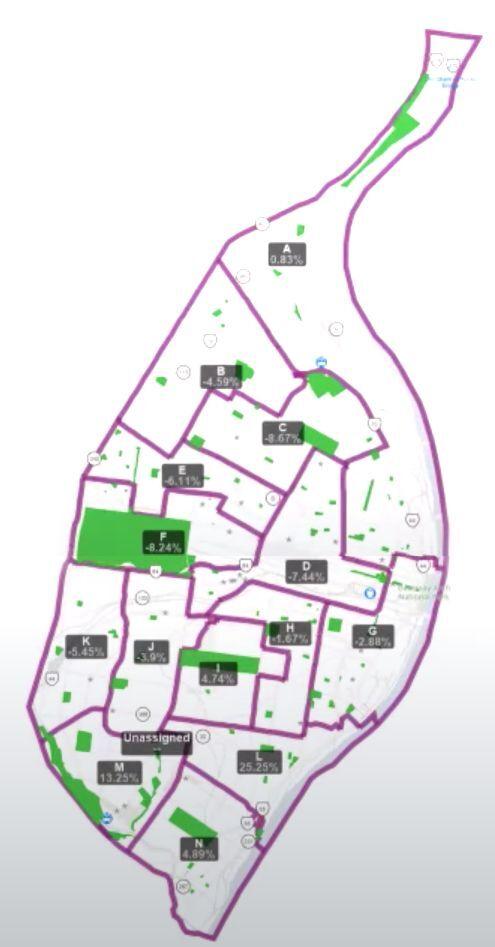
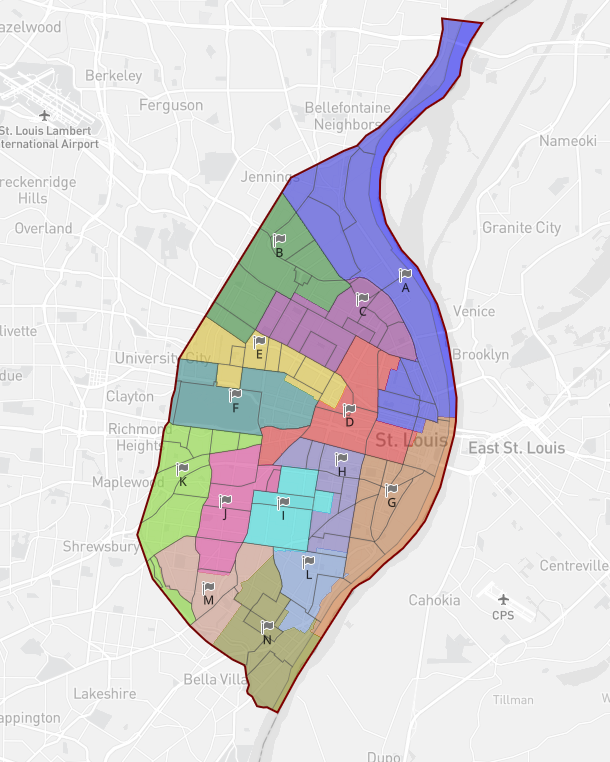
Over a recent lunch break, I fired up this tool and set to work to see how well I could do making a new ward map which met the stated goal of splitting up as few neighborhoods as possible. The results of that endeavor can be found in the Twitter thread below. As one can see from several of the replies, it’s difficult to make everyone (or anyone) happy when redistricting, as stated goals quickly run up against the realities of needing to keep the population figures roughly level, as well as have wards that at least logically make sense in terms of being able to be represented as a cohesive grouping of communities with. As any consumer of the news over the last several decades can attest, politicians often make a mockery of any of those concerns and choose their voters in increasingly incredulous feats of cartography, rather than letting the voters choose them.
The demographic breakdowns for each of my proposed new wards are shown below, and as you can see, while I was successful for the most part in keeping many of the City’s 79 neighborhoods intact, doing so comes at the expense of drawing as many minority minority wards as possible. The segregated nature of our City means some wards are either very white or very black, and there is a third grouping of wards that are diverse on some level, but at the levels needed to increase the number of majority minority wards, at least under my quick hypothetical.
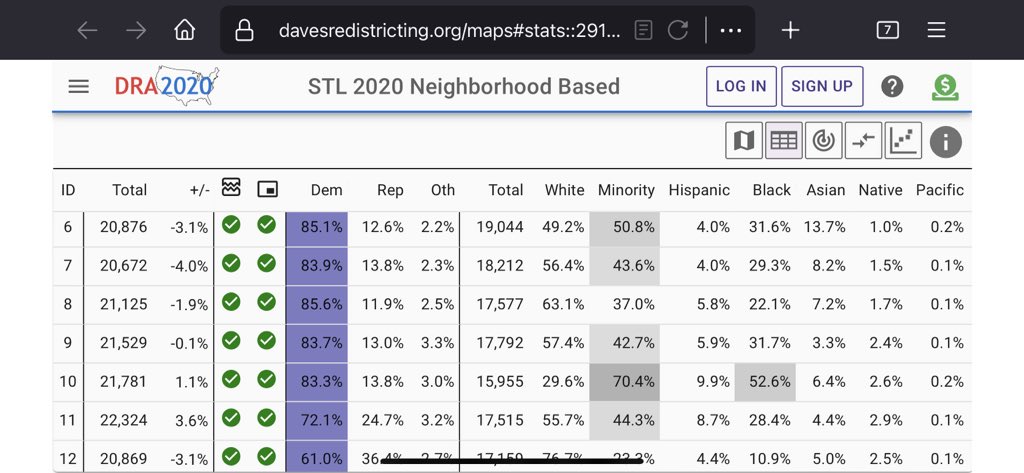
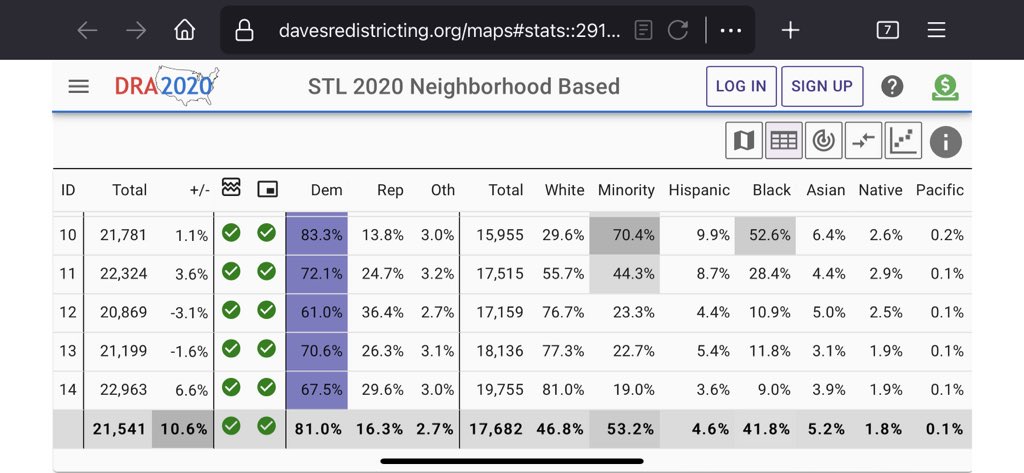
The issues I encountered were partially a product of working through the exercise fairly quickly, and partially a product of the realities of where people live in St. Louis City. The latter group of issues are likely the same difficulties that the Board of Aldermen will encounter over the next month as they iterate through several different versions of the new ward map before hopefully arriving at one that the majority of the current aldermen can agree to.
As residents, we have a once-a-decade opportunity to make our voices heard in this process, and to advocate for ourselves. We have tools at our disposal to check the politicians’ math, and make sure that we as voters are still maintaining the ability to choose our representatives, and not have our representatives choose which of us they want as their voters.
UPDATE: The Legislative Committee of the Board of Alderman released the following draft redistricting plan today.
Update Nov 8, 2021 – Latest revision
Update Nov 11, 2021 -Third revision
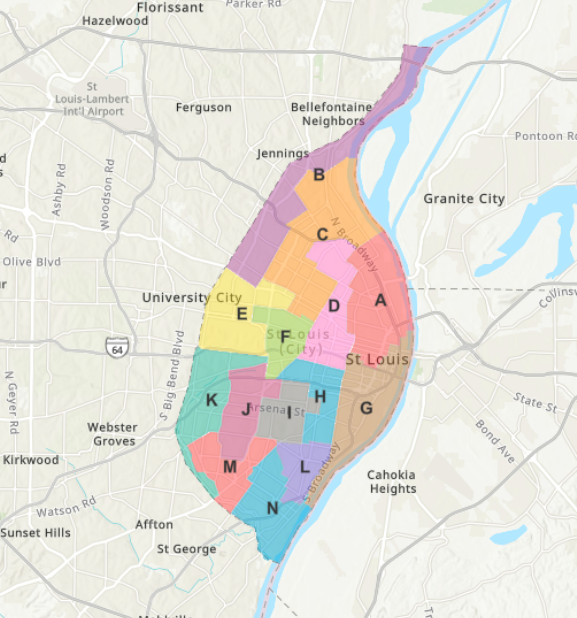
Update Nov 16, 2021 –
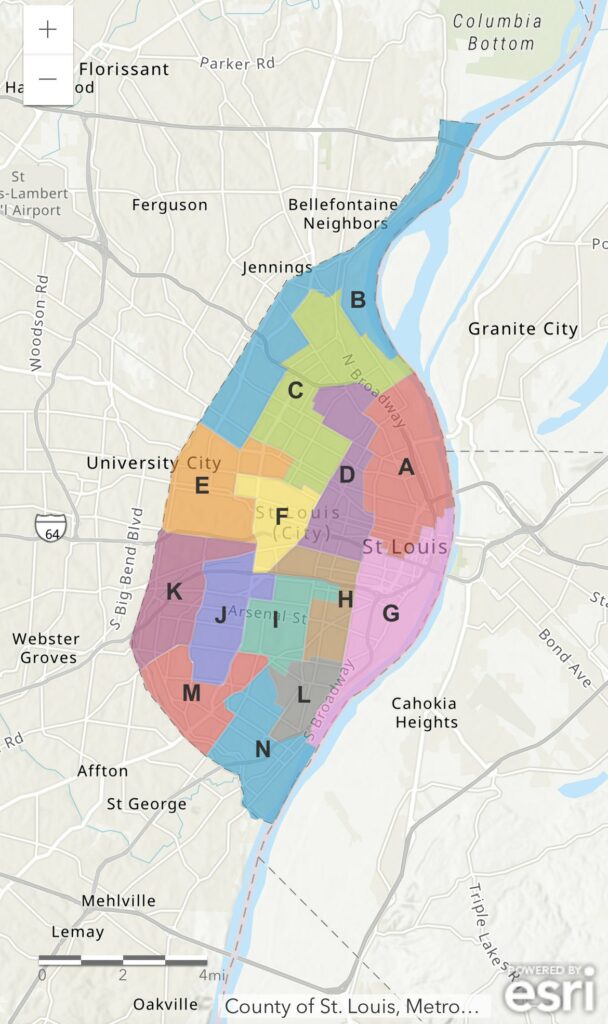
Update Nov, 18 2021 –