At a forum called Will We Be Better Together? hosted by Senator Jill Schupp at the Frontenac city hall, Professor Emeritus E Terrence Jones, author of Fragmented by Design, handed out a scatter plot titled Per Capita Local Government Spending by Municipal Density which appeared in More Municipalties= Less Municipal $pending? by Jones and James Brasfield, both members of the executive committee at Cities Strong, under the banner of UMSL’s Public Policy Research Center.
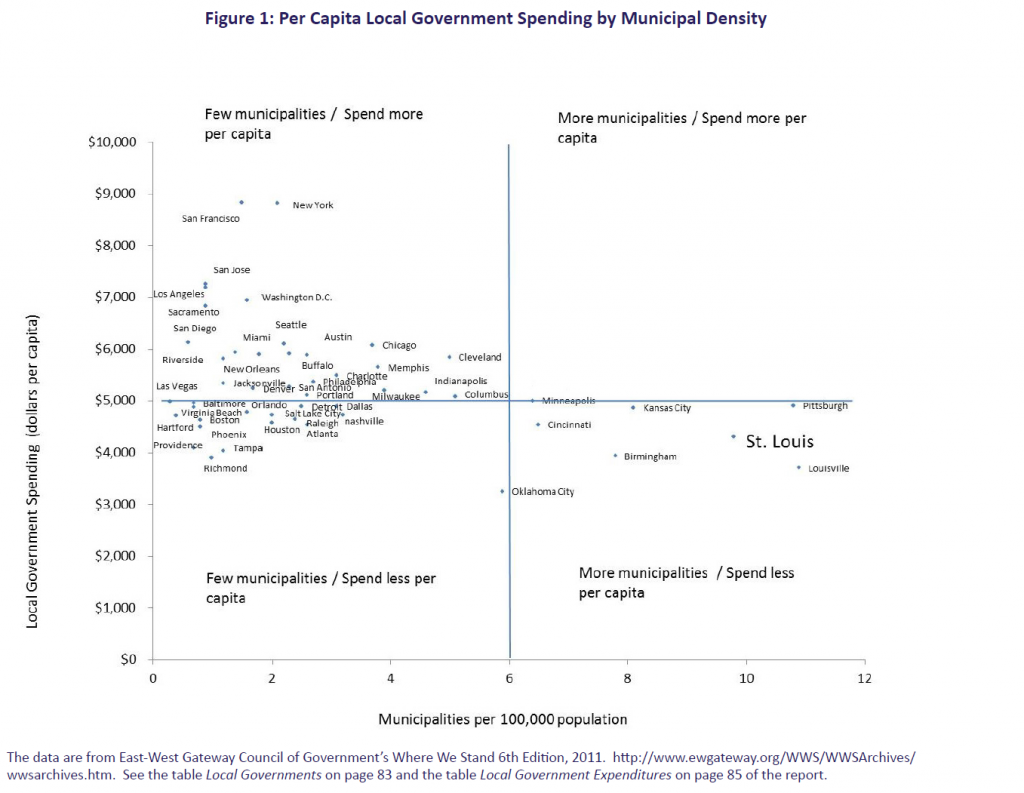
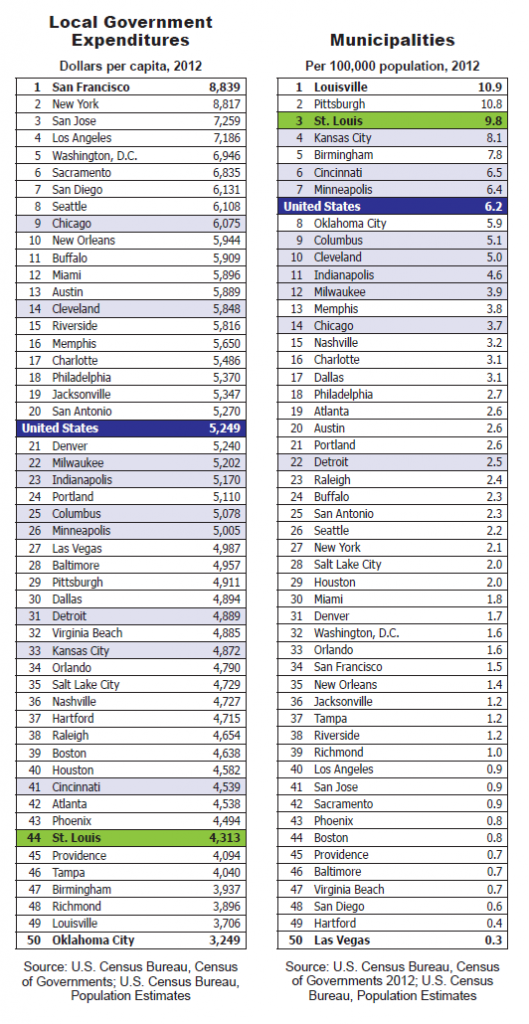
The data come from Where We Stand: The Strategic Assessment of the St. Louis Region periodically produced by East-West Gateway Council of Governments (EWG), our region’s metropolitan planning organization (MPO).
Jones and Brasfield divide the plot into four quadrants without justification (the lines bisect the range of the axes) and conclude:
The evidence is clear and convincing. For major U.S. metropolitan areas, having more municipalities does not create higher local government spending. It produces less. Conversely, more often than not, having more government consolidation does not lower spending. It often generates more.
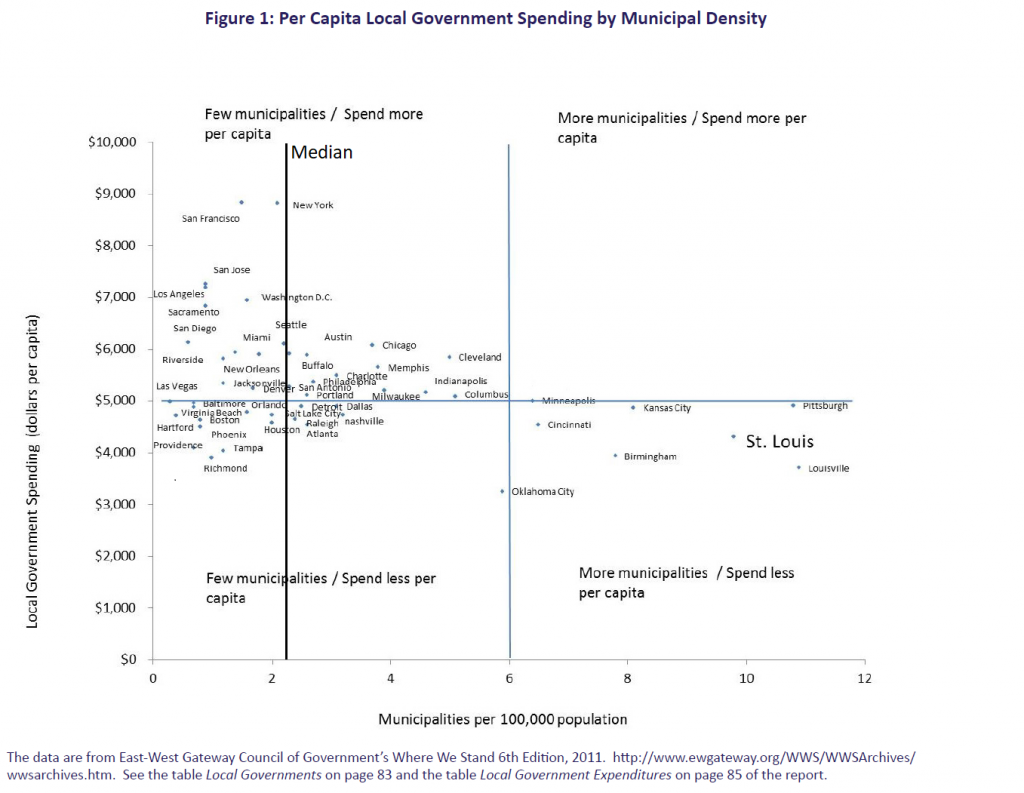
If one chooses to divide the plot by the median of the two data sets, the spending amount is about the $5,000 chosen, but the median number of municipalities per 100,000 is 2.25 (the average is 3.1 if you prefer). Using the median as the vertical separator, 25 metros are to the left and 25 to the right. Then there would be plenty of metros in the upper-right quadrant. Not much clear or convincing then.
Something else I noticed was that San Francisco and New York were very expensive outliers. Aren’t those very expensive places? Does this take into account cost of living? It doesn’t.
Factoring the cost of living index from the 2010 census for the metro areas into the local government spending amount produces:
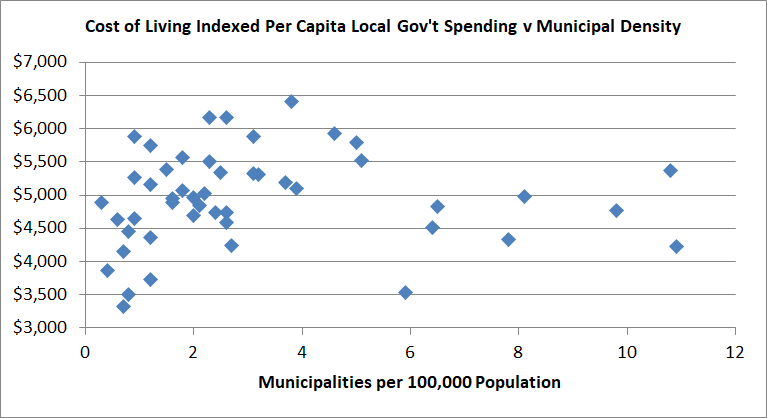
Which doesn’t seem to say much. Splitting into four quadrants at the medians ($4,863 and 2.25) places metros in all four again.
I notice, and this may be where I’m choosing things without justification, that there seems to be two groups. Splitting them up reveals a trend in each group where more munis tends towards more spending.
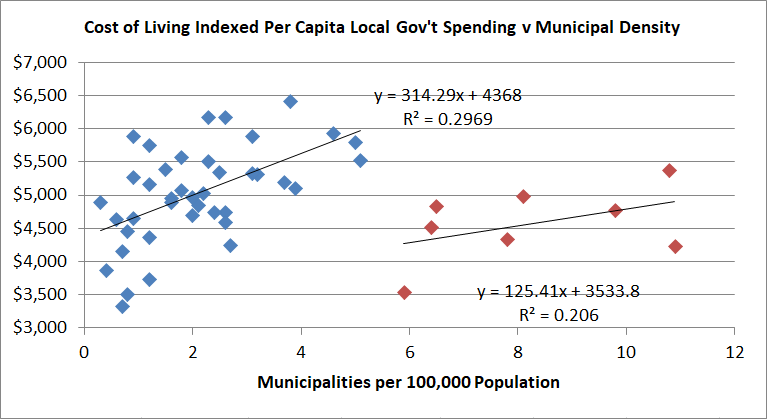
The red group members are Louisville, Pittsburgh, St. Louis, Kansas City, Birmingham, Cincinnati, Minneapolis, and Oklahoma City. How this came to be and why are subjects of much deeper analysis. Is the entire metro area the proper catchment area when counting municipalities for answering this question? OKC has large rural counties in its metro area, and Oklahoma County has 2.6 municipalities per 100k versus 5.9 in the metro area for instance.
As for the expenditure data here’s the kicker from Where We Stand:
Expenditures per capita by local governments range from about $3,000 per person in Oklahoma City to nearly $9,000 in San Francisco. Among the 50 peer regions St. Louis ranks 44th, with local governments spending the 7th lowest amount per capita. Nationwide, local governments spend the most on current operations for elementary and secondary schools (30.8 percent), followed by current operations for hospitals (5.1 percent) and police (4.9 percent).
The expenditure data include school districts and other local government entities, not just municipalities. I could say that the low fragmentation metros spend less on municipalities and put that into schools and these data wouldn’t support or refute that claim. These data also don’t inform whether metros are getting good value for money or how much state aid to local governments is a factor.
One simply cannot answer the question to what extent municipal density effects local government expenditures from these data. The data do reveal one thing for sure: municipal density on the order of St. Louis’ is not popular among the nation’s 50 largest metropolitan areas.
