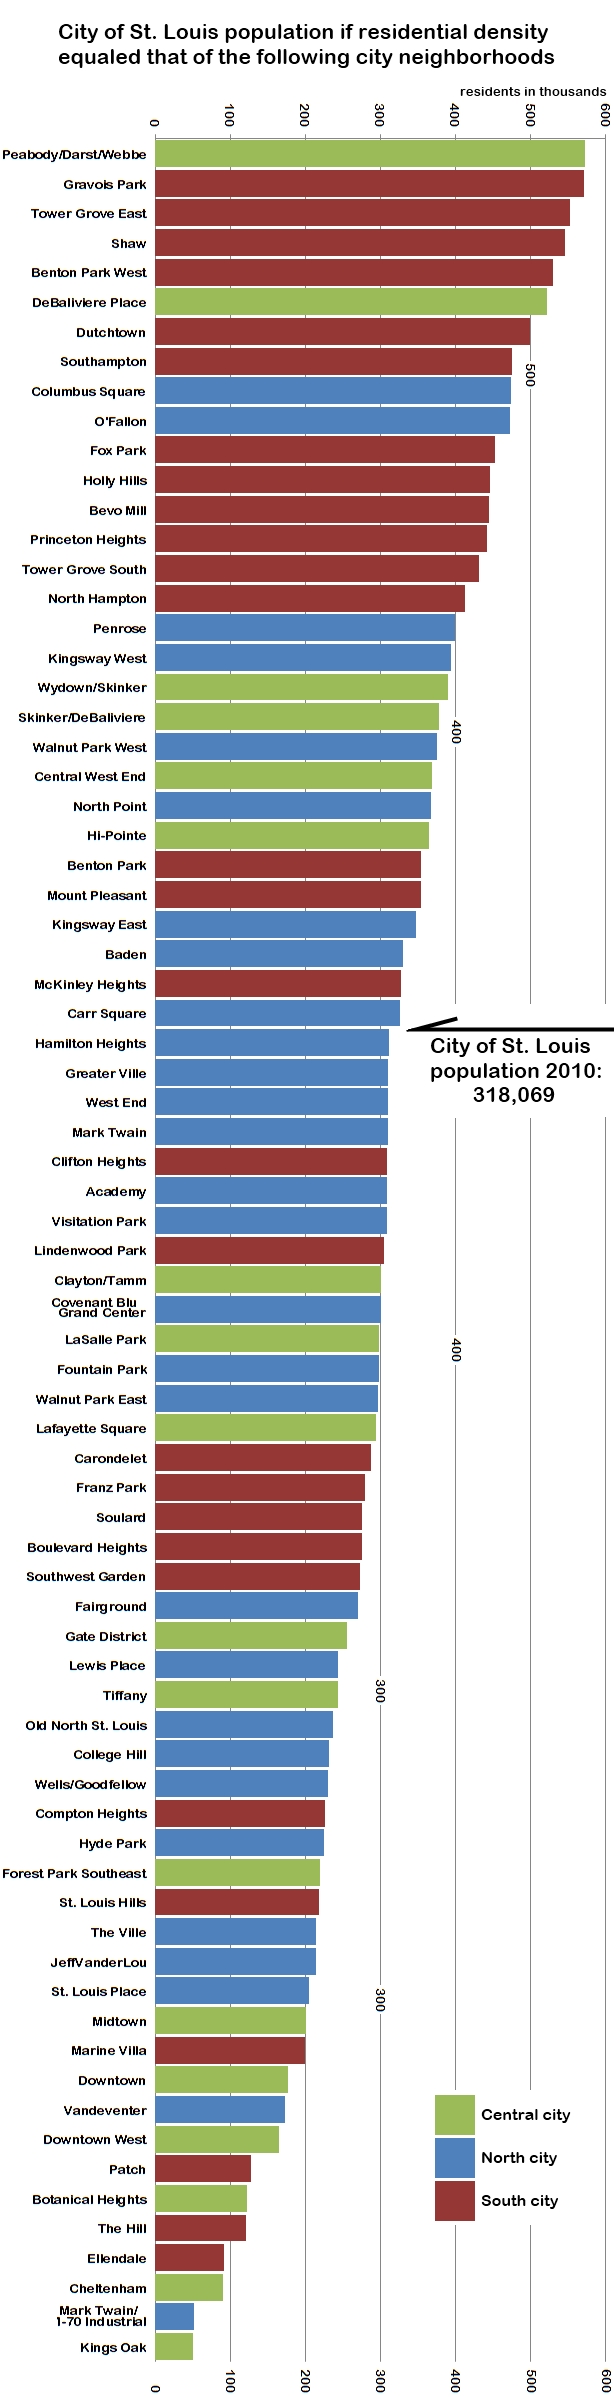

*for this graphic, habitable area of the City of St. Louis was calculated to be 48.176 square miles. The city is officially 66.2 square miles, with land area measured at 61.9 square miles. Subtracted from this were city parks, Bellefontaine and Cavalry Cemeteries and the largely industrial neighborhoods of North Riverfront, Near North Riverfront, Riverview, and Kosciusko
This graphic is meant to serve as the starting point for a better understanding of the city. Understanding St. Louis is the first step to considering what we want and what action to then take. Here, we can consider: Is population important to the city? If so, what’s the goal? Why? What would it look like? Where is our city relatively dense, and where is it not? Some popular neighborhoods are less dense than the city average (and in a city that’s 1/3 as dense as 1950). Do Lafayette Square or Soulard serve as a model for city development? If so, should we expect further depopulation? What does that tell us about the city we want, the city we’re building, and what to expect in the future?
________________________
For comparison, here are the population densities of some St. Louis County municipalities and other major U.S. cities (using total land area and not subtracting industrialized areas, parks or cemeteries):
University City 5,995/sq mi = an STL City of 371K
Maplewood 5,364/sq mi = an STL City of 332K
Webster Groves 3,897/sq mi = an STL City of 241K
Kirkwood = 2,993/sq mi = an STL City of 185K
Maryland Heights 1,284/sq mi = an STL City of 79K
Ladue 991/sq mi = an STL City of 61K.
San Francisco 17K/sq mi = an STL City of 1.06M
Chicago 12K/sq mi = an STL City of 734K
Washington D.C. 10K/sq mi = an STL City of 607K
Seattle 7.2K/sq mi = an STL City of 449K
Pittsburgh 5.5K/sq mi = an STL City of 341K.
