Eddie Roth is Chief Performance Officer for the City of St. Louis. He was a member of the St. Louis Board of Police Commissioners from 1998 to 2001
Alex Ihnen, of nextSTL.com, asks: Is the city of St. Louis becoming a safer place?" The answer, decidedly, is "yes."
Crime reduction is Mayor Francis Slay's top priority. He believes, with good reason, that St. Louis steadily and significantly has reduced crime (especially violent crime). He also believes crime remains unacceptably high, and that the St. Louis can do better — and that THE CITY IS poised for dramatic additional reductions of crime.
The Mayor brought IBM to town last spring to help us improve coordination and communication between the public and agencies that make up the city's criminal justice system – police, prosecutors, courts, corrections, probation, parole and neighborhood stabilization – agencies supported by taxpayers in the amount of nearly $250 million per year. He appointed Sam Dotson, a police captain, as director of city operations to ensure that all city services are viewed through the lens of public safety. He hired me in August as chief performance officer to help implement the recommendations in the IBM report (PDF).
In December, in keeping with those recommendations, Mayor Slay joined with the St. Louis Metropolitan Police Department and UM-St. Louis' Department of Criminology and Criminal Justice to form the St. Louis Public Safety Partnership. The partnership's purpose is to promote public safety in St. Louis through better use of law enforcement data – especially as a means to more disciplined and systematic planning and sustained evaluation of policing strategies for crime reduction.
The idea is to adapt policing strategies that have been subjected to rigorous evaluation in other cities and have been proven to be successful or to have great promise both in reducing crime and increasing public perception of safety and security.
In pursuing these tasks, St. Louis is building on strength.
The FBI's uniform crime reports for 2010 showed that reported violent crime was down 58 percent from the 20 year high in 1993 — including a 66 percent decline in robberies, a 54 percent drop in aggravated assaults, a 46 percent drop in homicides, with rapes down 41 percent. The incidence of violent crime was down further in all categories during 2011.
Even adjusted for the decline in city population during this period, this reduction in crime is striking.
One of course can manipulate the appearance of “crime trends,” positively or negatively, by using beginning and end points that are outliers.
St. Louis, for example, had 74 homicides in 2003 – a stunning count and the lowest number, by far, since 1962. During the preceding year, homicides had stood at 113. So, one could claim at striking 35.4 percent reduction in homicide and be factually correct. The following year, homicides went back up to 114, representing a depressing 54.1 percent increase!
Choosing an outlier year, though, tells us little about trends and even can be misleading.
Why I have I compared 1993 to 2010? I used 1993 because it represents a historic high in the incidence of violent crime and show how far over the past 20 years St. Louis has come in becoming a safer city. But the 1993 homicide count and violent crime totals (homicide, aggravated assaults, robberies, and rapes, combined) are not outliers. They are not unrepresentative of a 10 year period between 1988 through 1997 during which violent crime flourished as never before in St. Louis – with annual homicides averaging 200 and annual violent crime totals averaging 12,622.
Why use 2010 as the end point? Because that is the most recent year for which the FBI has published data (the St. Louis police department has internal counts for 2011 but it has not yet been reviewed by the FBI). And, as with the 1993 starting point, 2010 homicide counts and violent crime totals are not outliers.
These data show that St. Louis not only has made major gains in reducing violent crime, it has sustained those gains and continues to improve. The average annual incidence of reported homicides (130) and violent crime totals (7,507) over 10 years between 2001 and 2010 is less than half what had been reported in 1993 (homicides: 268; total violent crime: 14,998). Violent crime totals in 2010 were 6,205 and in 2011 were 5,951.
This is evidence of a city that is becoming safer.
* * *
Mr. Ihnen asks whether St. Louis has "enough" police officers. That, of course, depends on what he means by enough. If by enough he wonders how police staffing in St. Louis compares with that of other cities in St. Louis' population class, the answer is that St. Louis compares quite favorably.
Commissioned staffing in the St. Louis Metropolitan Police Department currently stands at 1,332 officers – or 4.17 officers per 1,000 population. In its annual publication, Crime in the United States, the FBI tracks law enforcement staffing slicing and dicing data in many ways, including by geographic region, population class of cities, and individual agencies.
According to the 2010 data, among the 74 cities with populations greater than 250,000, only 7 have 4.1 or more officers per 1,000 population. More than two thirds of all cities in this class had 2.5 or fewer officers per 1,000 – with the greatest number, 28 (37.8 percent), having between 1.6 and 2.0 officers per 1,000 population.
(The FBI reported that none of the 193 cities with populations between 100,000 and 249,000 had more than 4 officers per 1,000 population in 2010.)
There is another nuance to this staffing question. Departments differ in what jobs they fill with commissioned officers or civilian employees. Many jobs once performed exclusively by sworn officers now are ably assumed by civilians.
For example: Baltimore, according to the FBI's 2010 report, has a population of 639,929, double that of St. Louis, and is served by 2,960 police officers, more than double that of St. Louis, for a rate of 4.6 officer per 1,000 population. But St. Louis' police department has approximately the same number of civilian employees (523 as of Nov. 2011) as Baltimore's police department (543 in 2010).
Thus, if we measure staffing by total law enforcement employees, rather than by commissioned officers alone, St. Louis has 5.8 law enforcement employees per 1,000 and Baltimore has 5.5.
In the end, every city has unique challenges, culture and expectations when it comes to police service. Each must answer for itself as part of the political process how many police officers are "enough." There is no fixed formula for police staffing.
But what the data show is that St. Louis, pound for pound, stands among cities that devote the greatest amount of staffing resources to their police departments. What's more, St. Louis experienced major crime declines over past 15 years as three successive chiefs (Henderson, Mokwa and Isom) steadily reduced commissioned staff by nearly 20 percent (from 1623 officers, in 1998, to 1335, today.)
* * *
Mr. Ihnen's focus on homicides is helpful in illustrating limitations on the usefulness of conventional city crime data — and why it is essential to dig deeper for context. Here’s an example:
Many of St. Louis 79 neighborhoods are comparable in scale and population to smallish to middle-sized suburban municipalities. Collectively, they experienced 114 homicides in 2011.
Thirty (30) St. Louis neighborhoods had no homicides at all. Twenty-one neighborhoods (21) had one homicide. St. Louis Hills, in South St. Louis, is among those neighborhoods with no homicides. Its population of 7,373 is comparable to Maplewood's 8,046.
Now consider this:
Fifty four (54) of the homicides committed in 2011 (47.8 percent) took place in 10 neighborhoods in which 14.7 percent of the city's total population reside. Penrose Park, in North St. Louis, in a rough sense, stands at the geographic center of many of the neighborhoods that had the highest incidence of homicide.
But Penrose Park experienced no homicides and little reported crime in 2011. Under conventional city crime compilations, though Penrose Park would receive no credit for being virtually crime free. Neither would St. Louis Hills. Both would be painted with the same brush as neighborhoods with the highest incidence of homicide, solely because all are situated within in the municipal boundaries of the city of St. Louis.
Yet, Clayton and Ladue because they are outside the political boundaries of St. Louis city, would be exempt from official comparison, even though they may be closer, or in similar proximity, to neighborhoods with high concentrations of violent crime. Penrose Park, according to Google maps (via city streets) is situated closer to Shaw Park in Clayton (7.8 miles) than it is to Francis Park (8.8 miles) in St. Louis Hills. St. Louis Country Club, in Ladue, roughly is equidistant (10.6 miles). .
* * *
Can police make a difference in reducing crime beyond reductions BEYOND that which can be attributed to broader social and demographic shifts? It appears they can and do, and in very significant ways.
St. Louis Chief of Police Dan Isom told the Post-Dispatch that "we look at the data and throw 10 different things at a neighborhood to reduce crime, but we really don't know which one worked."
The Public Safety Partnership has been organized to help the criminal justice system better and more rigorously track, implement, and evaluate what works.
A recent paper by respected criminologists delivered at a national conference at John Jay College of Criminal Justice in New York, What is Known about the Effectiveness of Police Practices? (PDF) summarizes what are believed to be leading contributors for crime reduction, overall, and Explanations for Contemporary Crime Drop(s) in America, New York City, and Many Other Places (PDF) summarizes findings of police strategies have had the biggest impact in reducing crime.
Being disciplined, sustained and systematic in the planning, coordination, communication, and evaluation police and other criminal justice strategies contributes to reduction in crime.
Mayor Slay is committed to bringing that kind of discipline to St. Louis’ criminal justice system, to build on past success, to make every neighborhood in the city safe — and to thoughtfully present a steady flow of good data with plenty context so the public can make its own judgments about public safety in St. Louis.
* * *
St. Louis neighborhoods and city parks with No Homicides in 2011
Bevo Mill
Botanical Heights
Calvary-Bell Cemetery
Carr Square
Central West End
Cheltenham
Clayton-Tamm
Clifton Heights
Compton Heights
Covenent-Blu/Grand Center
DeBaliviere Place
Ellendale
Fairground Park
Forest Park
Forest Park SE
Fox Park
Franz Park
High Pointe
Holly Hills
Kings Oak
LaSalle
Mark Twain/I70 Ind.
Midtown
North Hampton
Patch
Penrose Park
Princeton Heights
Skinker-DeBaliviere
Soulard
South Hampton
Southwest Garden
St. Louis Hills
St. Louis Place
The Gate District
Tower Grove Park
Visitation Park
Willmore Park
Wydown-Skinker
The 10 St. Louis Neighborhoods with 4 or more Homicides in 2011, representing 14.7 percent of the city’s population but 47.8 percent of homicides citywide.
Baden (10)
College Hill (4)
Gravois Park (4)
Hamilton Heights (5)
Jeff Vanderlou (9)
Mount Pleasant (4)
The Greater Ville (5)
Walnut Park East (4)
Walnut Park West (4)
Wells-Goodfellow (5)
____________________________________________
Mr. Roth’s reply to the Is the City of St. Louis a Safer Place in 2011 than in 1971? How Are We Supposed to Know? above is posted unedited and in full. nextSTL believes it’s important to hear varied viewpoints and is grateful that Mr. Roth took the time and effort to add to this important discussion.
Editor’s response from Alex Ihnen:
Last week I used a quick look at the homicide rate in the City of St. Louis from 1970 to 2011 to frame the question, “Is the City of St. Louis a safer place?” It wasn’t a scientific question and I wasn’t looking for a definitive answer. The purpose was to look at the long trend in St. Louis and not specifically to address the current Mayoral administration. The point was that there aren’t easy answers to questions of crime and safety.
What’s obvious is that the time frame makes all the difference. Mr. Roth would like us to view crime in St. Louis through the lens of comparing 1993 to the present. Why 1993? As Mr. Roth puts it, “I used 1993 because it represents a historic high in the incidence of violent crime and shows how far over the past 20 years St. Louis has come in becoming a safer city.”
He states that 1993 isn’t an outlier, but an historic high is just that. Within the most violent period in our city’s recent history, 1993 stands out. From 1988 to 1993 homicides increased 91% in the city. From 1993 to 1997, homicides decreased 43%. Using the year 1993 is a political choice, not an analytical one. It is the one year that puts the current administration in the most favorable light.
If the city’s record since 1993 has been one of less and less crime, the current administration’s record is less clear. Over a six-year period, from Mayor Slay’s second to seventh full years in office, the homicide rate in the City of St. Louis increased 126%. I don’t believe that this is a fair (factual) statistic by which to judge the crime fighting performance of this administration. The 74 homicides of 2003 is an outlier, which I’m sure the Slay administration would be happy to point out. How is using 1993 any more honest, and most importantly, more informative, than 2003? Why is using the "historic high" less biased than using the historic low? To quote Mr. Roth, "Choosing an outlier year, though, tells us little about trends and even can be misleading."

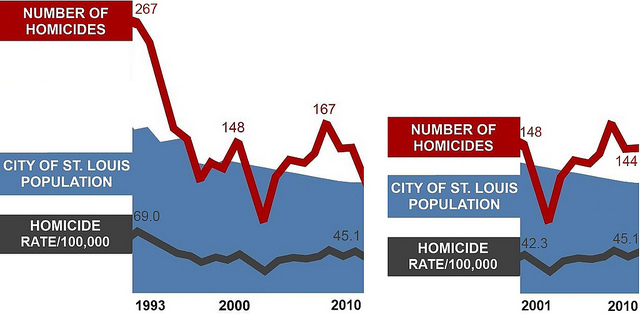
{left: the City's Chief Performance Officer would have us focus on 1993-2010, right: viewing homicides during the Slay administration from 2001-2010}
Choosing 1970 as a starting point was pragmatic rather than political, on my part. It was the first year for which I could easily find reliable data. Of the 41 years from 1970 to 2010, 78% had a lower homicide rate than 1970; choosing any one of those 32 years would have put the city in a more unfavorable light.
But it's generally not the city's use of statistics that is concerning. The problem is with a local press that regurgitates crimes stats without context. We get news like this: The number of serious crimes committed in the City of St. Louis dipped last year to levels unseen in more than four decades, according to new crime data released Wednesday. Sounds good. It's "crime data" – sounds authoritative. Again, in a city with one-half as many residents as four decades ago, it is the crime rate that is relevant.
Clearly much of the City of St. Louis is a safe place – something I shout at any and every opportunity (sorry if you’re sitting close to me). The majority of violent crime occurs in concentrated areas of our city. Mr. Roth’s right to point out that safe parts of the city are unfairly labeled as dangerous while some county municipalities, including Clayton, are nearer to the most violent neighborhoods, and considered exceptionally safe. Certainly the Mayor’s office and nextSTL will continue to fight that perception battle.
New efforts such as partnerships with IBM and UM-St. Louis are positive and important initiatives. Mr. Roth’s information on the number of police officers and the nuances of law enforcement employees is very helpful in understanding how St. Louis compares to other cities. The number and rate of violent crimes in the City of St. Louis has been decreasing and over the last couple years, the city has become a safer place overall. We all hope that the city is poised for additional dramatic reductions in crime. And when it happens, we’ll be cheering alongside everyone else, congratulating those who made it happen.
So what’s the next question? If violent crime in St. Louis is decreasing, is it doing so at a faster or slower rate than cities such as Detroit, Cleveland, Baltimore, Memphis and others? Why or why not?
More recommended reading:
Crime and the Great Recession – City Journal
Why Crime Is Down in America's Cities – The Atlantic
Why did violent crime drop by 13% last year? – Friends of Justice
Is There an “Obama Effect” on Crime? – Slate
Freakonomics: Why crime continues to fall during a bad economy – American Public Media
How the Plummeting Price of Cocaine Fueled the Nationwide Drop in Violent Crime – The Atlantic

