
We tax and spend a lot on local government in the St. Louis region. Maintaining fragmentation and infrastructure to serve spread out areas means we’re each on the hook for more than otherwise necessary for local government. Every election includes tax increases (Aug 2, 2016, Apr 5,2016). This November will be no different with a property tax to fund a senior service fund on the ballot in St. Charles County, St. Louis County, and St. Louis City Too Cool for a County.
Serving the growing senior population is a challenge for the nation as a whole, not just St. Louis; a challenge made all that more difficult because aging in place for too many means aging in places that are incompatible with aging.
Three big revenue sources of our local governments are sales, property, and, for the city, earnings taxes. How have the tax bases for these done lately?
Taxable Sales and Use I took a look at the sales tax base in May. To recap taxable sales and use were impacted by the recession and have recovered about half the drop since. No doubt a factor is the ever increasing amount of internet sales, much of which aren’t taxed.
 {St. Louis County brings up the rear}
 {Source data from the Missouri Department of Revenue}
Assessed Value Property taxes are calculated from assessed value. School districts levy the biggest share of property taxes. In March I took a look at the financial resiliency of our school districts, and it wasn’t pretty. St. Louis County dominates out of sheer size.
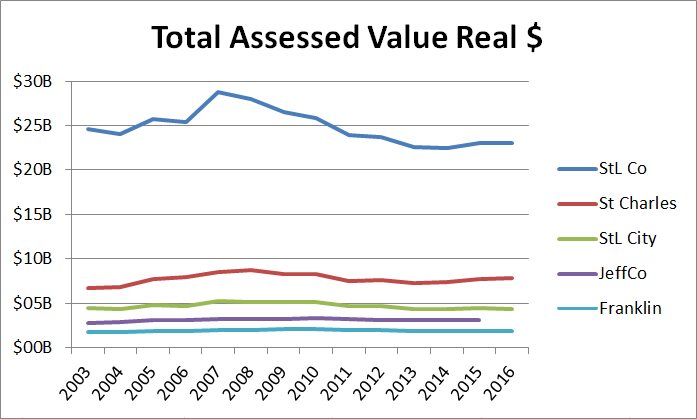 {Source data from the Assessor’s office in each county}
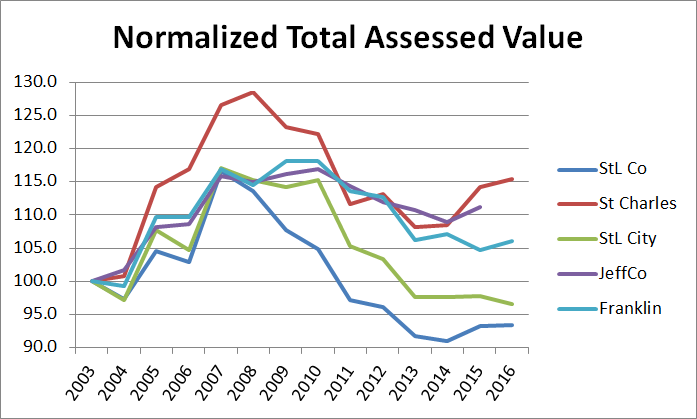
Setting 2003 to 100 to compare trends reveals the impact of the recession and how the recovery has gone. Once again pre-recession levels haven’t returned. St. Louis County brings up the rear again.
Adjusted Gross Income We see the effect of the recessions here as well. St. Louis County was especially hard hit in 2009. The closure of two auto assembly plants probably accounts for a lot of the decline there. Every county is ahead of 2000 with St. Louis County just barely ahead. St. Charles County is the big winner as the region continues to spread out.
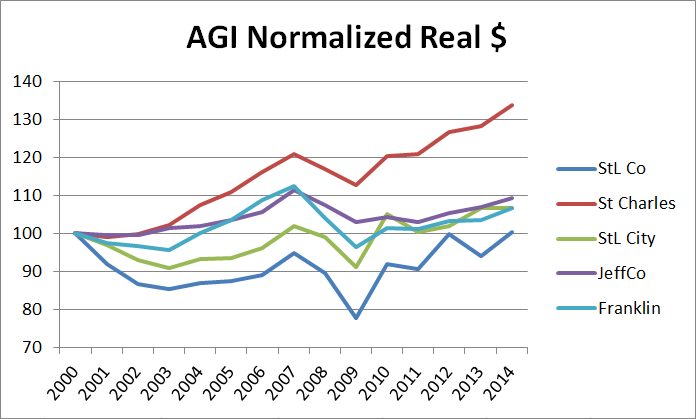 {Source data from the IRS. St. Louis County brings up the rear again.}
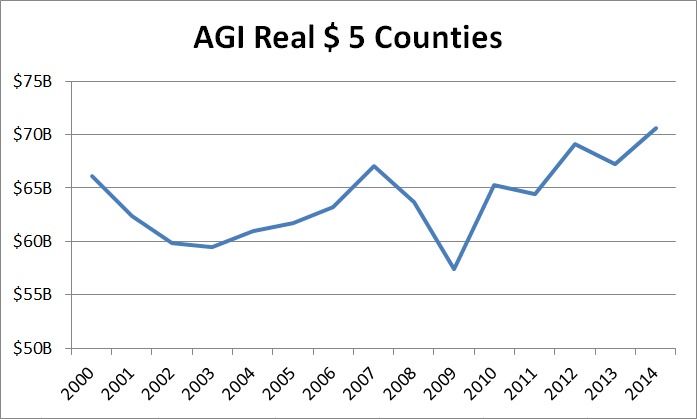
Total AGI of the 5 counties together has increased by 7% since 2000. Despite the earnings tax (Note the earnings tax doesn’t tax all AGI which includes interest, dividends, capital gains, etc), the AGI of residents of St. Louis City has kept pace with the region. The increase in St. Charles County makes up for the trailing St. Louis County (a 7% increase in STL Co would mean $3B more. St. Charles increased by $3.4B over the same period).
The lagging St. Louis County should be of great concern to its leaders and those all around the region. As its buildings, infrastructure, and populace age, and the same forces that undermined the city in decades past do their work on the county, it’s time for a hard look at our structure and policies. Will we continue to pretend that municipal borders protect us from what’s happening on the other side? Will we continue to pretend that fragmentation is a feature and not a bug? Will the region realize that spending money on infrastructure on the edges is adding liabilities that outweigh the benefits? Considering the fragility of taxable sales, is it the best well to keep going to? Is our mix of sales, property, and earnings taxes optimal given recent trends?
