
Welcome to the Murder Capital. As an epithet, it’s right up there with Gateway to the West and Mound City. Cursory Google searches about St. Louis tend to highlight the danger inherent to this place. Historic white flight and modern Black flight are, in part, predicated on a notion and narrative that St. Louis is no more than an arena for killers and victims.
NextSTL – 2012 – Understanding St. Louis: homicide and index crime totals and rates 1943-2012
NextSTL – 2012 – Understanding St. Louis : Homicides 2005-2012
Though it may be of immense desire to dismiss homicide in the city as little more than fearmongering, the nation-leading homicide rate every year since 2015 hovering north of 60 per 100,000 residents should act as a touchstone for our sense of reality. Killing, and a lot of it, happens in St. Louis City. To dismiss that is to gaslight the lived experience of our communities.
What we should do, though, is better understand how homicide impacts different groups in the city. Going back five years, the chart below shows the homicide victims by race.
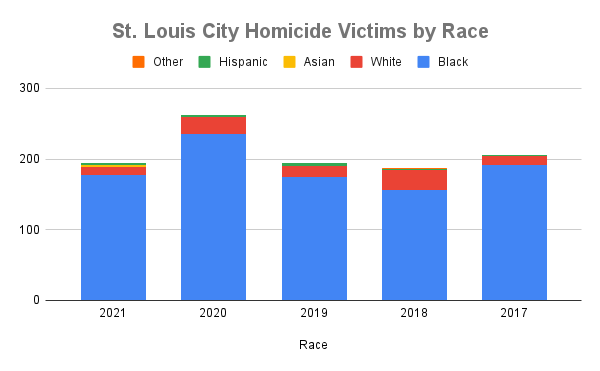
Using the 2020 census, we can also look at rates by race. This calculation is taken using the five-year average of homicide victims by race and then dividing it by the 2020 population by race. Then, that number is multiplied by 100,000 to get the homicide rate. I have also included the daytime population (the best data I can find on that is from the 2010 census, so it may be a slightly lower number given the city’s loss in population – take it with a grain of salt).
- Black = 144 per 100K residents
- White = 14 per 100K residents
- Asian = 5 per 100K residents
- Hispanic = 14 per 100K residents
- Daytime Population Homicide Rate = 48 per 100K
To further build an understanding, let’s take a look at some other places that do not generally get national attention for homicide. All numbers below are taken from 2019 to negate the spikes in homicide that happened nationwide in 2020.
- U.S. = 5 per 100K residents
- Boston = 6 per 100K residents
- Phoenix = 8.5 per 100K residents
- Charlotte = 12 per 100K residents
- Nashville = 11 per 100K residents
In looking at this data, we see two very different experiences. Black residents are at a far greater risk in the city. Meanwhile, non-Black residents have a rate resembling national numbers.
White folks, and particularly those from outside of the city who rant about their safety on every Post-Dispatch article, should understand that St. Louis is relatively safe for them. No, they don’t need to bring their gun Downtown for a Blues game. In fact, not only is the homicide rate for white residents similar to perceived safe cities, nearly 80% of homicides over the last five years were committed by an offender with a relationship to the victim (this includes acquaintances). When we focus our safety measures, both proactive and reactive, on appeasing the largely unfounded fears of our most privileged groups, we may fail to meet the needs of those most impacted. This needs to change.
Conversely, the homicide rate for Black residents is startling and the city should be making every effort to improve safety for the Black community. Investing in community, funding start-ups and small businesses, rehabbing vacant properties, building more recreational centers, and offering more after-school programming (both for youth and adults) all could help to improve safety without increasing police presence. Additionally, programs like Cure Violence and other intervention strategies may continue to play a valuable role.
It is important to understand that violence in St. Louis is dynamic and unequally distributed. From there, we can dismiss the sensationalized fears of some groups while working to ameliorate the lived experiences of others. Having an unfocused understanding of crime can lead to the wrong actions.
So far in 2022, St. Louis has 13 homicides through the first month of the year. If that trend continues, considering the 5-year average for homicide rates by month, St. Louis will see the following in 2022:
- 156 homicides
- A homicide rate of 51.7 per 100K residents
- Black victims = 143 or 110.1 per 100K residents
- White victims = 13 or 9.8 per 100K residents
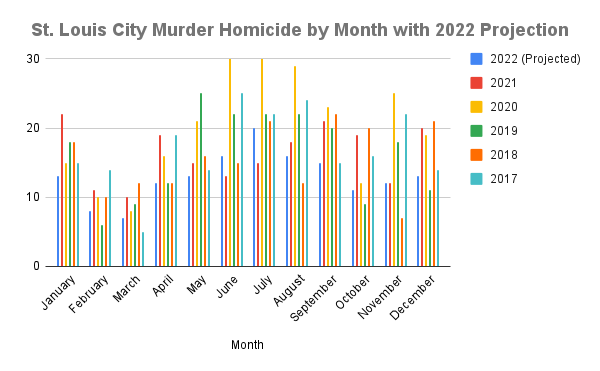
This number would be the lowest in total deaths since 2013 and rate since 2014. It’s early, and we shouldn’t get over our skis. But there is some hope for St. Louis to continue its progress from 2021 to have a safer city for all.
