St. Louis has demolished fewer buildings to date in 2018 than it did last year, and less than in most years since 2000. Statistics released by the Building Division show that the City has issued 254 demolition permits through June of this year, while it had issued 346 by the same time last year. While Metropolitan Sewer District demolition in north city has concentrated demolition, overall demolition activity remains slightly down – on demand, undirected and not correlating with redevelopment except in the parts of the city with high valuation. Everything else seems scattershot, but another half of the year remains.
Recently Mayor Lyda Krewson issued the city’s strategic goals for reducing vacancy, and demolition again is front and center as a tactic. That is hardly surprising, given the continued decline of the city’s population and the fact that St. Louis has some of the highest percentages of vacancy in older American cities. A new study published by the Lincoln Land Institute and authored by Alan Mallach, The Empty House Next Door, identifies St. Louis as having a median Census tract vacancy rate of 18.5% in 2010, which compares to Cleveland’s 20.2% but surpasses Pittsburgh’s 11.2% and Buffalo and Baltimore’s 13.6%. Moreover, Mallach found that St. Louis has a hypervacancy rate – areas with high concentrations of vacant buildings and land — of 46.2%, behind Cleveland at 50.2% but ahead of Baltimore’s 29.5%, Buffalo’s 27.8% and Pittsburgh’s 19%.
Clearly, St. Louis has work to do, and some of it involves the bulldozer (or the deconstruction crews that MSD and the city are exploring as partners). The question remains whether the city’s approach to demolition – accelerated as the mayor’s document proposes – will stem these trends or simply be a neutral variable in the metrics of decline. Vacancy is as much a problem of vacant land as of buildings, since both have heavy fiscal costs to cities. Demolition does relieve a perceived liability and some carrying costs, but it also does not necessarily lead to reductions in hypervacancy, increases in property values or even increase in public safety measures. Certainly St. Louis has learned that demolition does not lead to population increases.
Here is a mid-year review of demolition in the City of St. Louis.
Most Demolitions Private; Over 12,000 Permits Issued Since July 1999
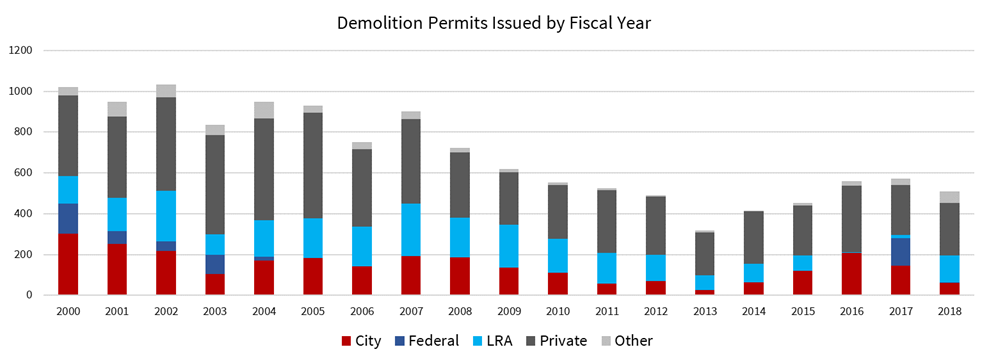
Although the MSD project this year and the NGA project in the last two years have entailed many publicly-funded demolitions, the plurality of permits issued by the Building Division are still for privately-owned and privately-funded demolitions. In 2018 to date, that has been 44% of all permits issued. City-funded demolitions come in second as 28%, followed by MSD as 21%.
Since July 1999, the city has recorded issuance of 12,515 demolition permits. Private demolitions – some 6.290 permits – account for exactly half of the permits. Permits issued to the landbank, the Land Reutilization Authority (LRA), are in second with 23% (2,947), closely followed by demolitions funded by the city at 22% (2,742). The federal government has received 5% (572), for transportation and other infrastructure projects.
The US Census Bureau reports that 36,785 persons have moved out of the city between 2000 and 2016. While this is not a direct result of demolition, it remains a provocative coefficient. No one knows how closely related are the decline of the city and demolition practices, but it remains worthy of further study.
Metropolitan Sewer District Demolitions Impacting Six North St. Louis Wards
The Metropolitan Sewer District (MSD) received approval in its federal consent decree to implement stormwater separation by physical separation in more densely populated parts of the city, while demolishing vacant buildings and creating passive green space in less densely populated parts. No St. Louisan likely will misunderstand the impact of this decision – the program is demolishing vacant buildings and producing vacant lots in north St. Louis and implementing more costly measures in south and central St. Louis.
MSD is working with the city’s landbank, the LRA, to select and demolish buildings. In 2018, the demolitions have only occurred in north city wards 1, 2, 3, 21, 22 and 27. Ward 22, which includes Hamilton Heights and Wells-Goodfellow, has seen the plurality of these demolitions, with 43 demolition permits issued through June. Ward 1 has had 14, Ward 2 has had 12, Ward 27 has had 5, Ward 3 has had 3 and Ward 21 has had 2.
MSD and LRA have stated that the end goal is the demolition of 1,300 vacant buildings. If concentrated in the current geography, that number will significantly reduce building and housing unit counts in wards 1, 2, 3, 21, 22 and 27.

Demolition Highest in High-Demand and High-Vacancy Areas
Non-MSD demolition activity follows no real pattern, although generally wards with higher poverty and wards with higher real estate values have more demolition. The top two wards for non-MSD demolition to date this year are ward 25, with 64 permits, and ward 7, with 31. Ward 25 includes Dutchtown and Amberg Park, among other areas, where vacancy and poverty are higher than city average. Ward 7, on the other hand, includes downtown, LaSalle Park, Soulard and surrounding areas where most demolitions correspond to new construction.
Other wards with significant demolition activity are wards 2 and 3, with 22 permits each, ward 1, with 20, and ward 20, with 19. Wards 1, 2 and 3 are located in north St. Louis, and ward 20 in south St. Louis. All have high vacancy rates.
Wards recording almost no demolition activity so far this year include wards 11, 16, 18, 23 and 28, with 1 permit each. Wards 15, 17 and 19 have no permits yet. This geography confounds some assumptions, because ward 18 includes the high-vacancy neighborhoods of Academy and Fountain Park, and wards 17 and 19 include increased-demand areas and institutions like CORTEX and St. Louis University.
Generally, the year-to-date demolition records show that, beyond the MSD targeted project, permits show a continued system of demolition on demand. The city responds to both private demand, usually related to construction projects, and public demand from the LRA, aldermen and the administration, which usually targets vacant buildings for demolition without any redevelopment plan.
Demolition Spending Generally Low
In 2017, the city recorded demolition permits totaling $1,340,317. That is down significantly from the peak of the last ten years in 2010, when permits totaling $3,473,255 were issued. The costs of demolition have not declined, but the majority of buildings being demolished in the last two years have had relatively small demolition costs, indicating that they are houses or small storefront buildings.
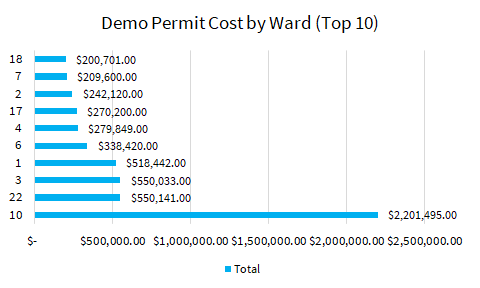 Big projects can still tilt records, though. For instance, the highest demolition costs to date have been incurred in Ward 10, at $2,201,495. However this reflects the demolition of the massive American Stove Company factory on The Hill, which will be replaced by an apartment development. The next highest ward by cost was 22, where MSD demolitions joined others for $550,141 in permitted activity. Ward 3 was closely behind with $550,033 in permitted activity, with Ward 1 at $518,442 to round out the wards with a half-million dollars or more in permitted demolition.
The city has not spent even half of its use tax demolition fund this year — $999,028 remains and $771,972 has been spent. While half of the year has passed, half of the public demolitions remain ahead. Check back with nextSTL for a year-end report.
