The Hazelwood School District plans to cut $6.6M from its 2016-17 budget. The district has been running an operating budget deficit for three years with a projected shortfall of $12.7M for the 2017-18 school year. Parents are irate over the cuts, overflowing school board meetings, and petitioning for a state audit.
An audit may or may not reveal areas for improvement and some fat to trim. What it won’t cover are the larger forces at work. What looks like a cash flow problem here, and for local governments across the nation, is really a growing insolvency problem. If what is minimally expected in service and infrastructure level is X, the maximum tolerable taxes are Y, and Y is less than X in the long term, the government is heading toward insolvency. From the sound of it, with the proposed cuts, parents aren’t getting X.
Well known is the flight of residents and jobs from the area, undermined by the subsidy-encouraged flight to the west. Jamestown Mall died. The St. Louis Outlet Mall sold at a blue light special price. The Page Avenue extension and Hwy 370 kept commute times low for residents in new developments to the west. Federal housing policies (See Strong Towns’ numerous great housing articles) continue to favor building new single family homes on the edges.
This is the same build-abandon-build-abandon story told across time and space in the St. Louis region and elsewhere, brilliantly covered in Colin Gordon’s book, Mapping Decline. It’s not possible to overstate how important it is to read that book for anyone concerned with issues in St. Louis. Spanish Lake, of which a documentary chronicles the phenomenon, is in the Hazelwood School District.
What is less appreciated is the fragility of the development pattern that pervades the school district. The district spans 78 square miles (a good portion still floodplains and farms), more area than the City of St. Louis. It serves 6,000 fewer students than St. Louis public schools. The assessed value of all property in the district is $1,598,735,070. SLPS is $4,210,986,731.

The Hazelwood School District has the 2nd highest property tax rate among the 30 districts in St. Louis City, St. Louis County, and St. Charles County. That’s the Y in the service funding equation.
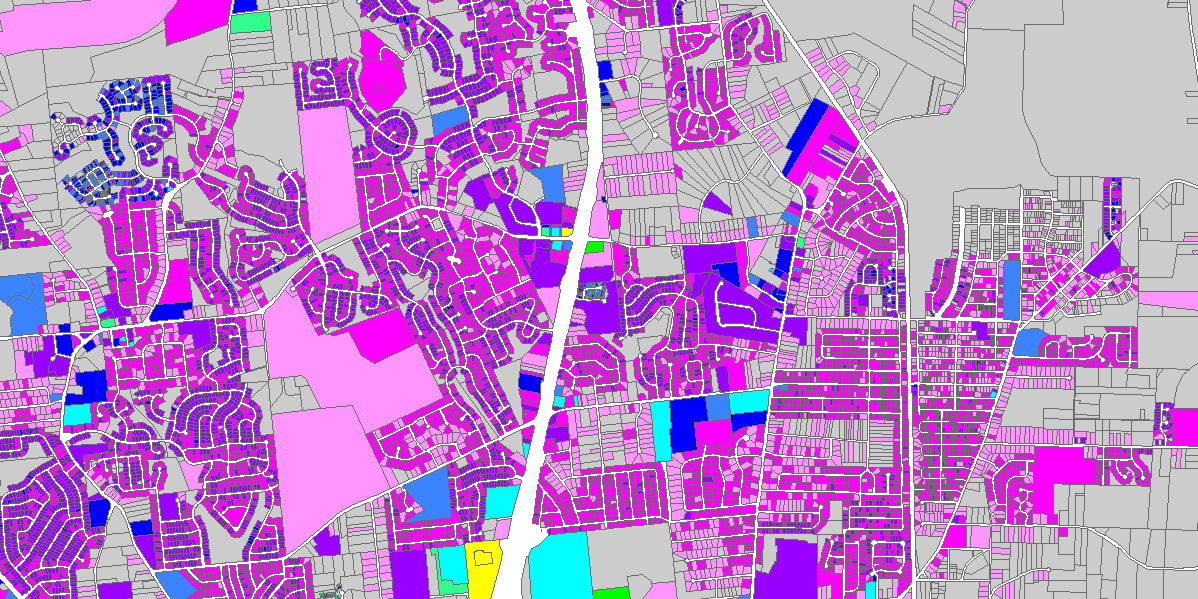
 {East side of the district. I270 near the bottom. Click on the image for a larger version.}
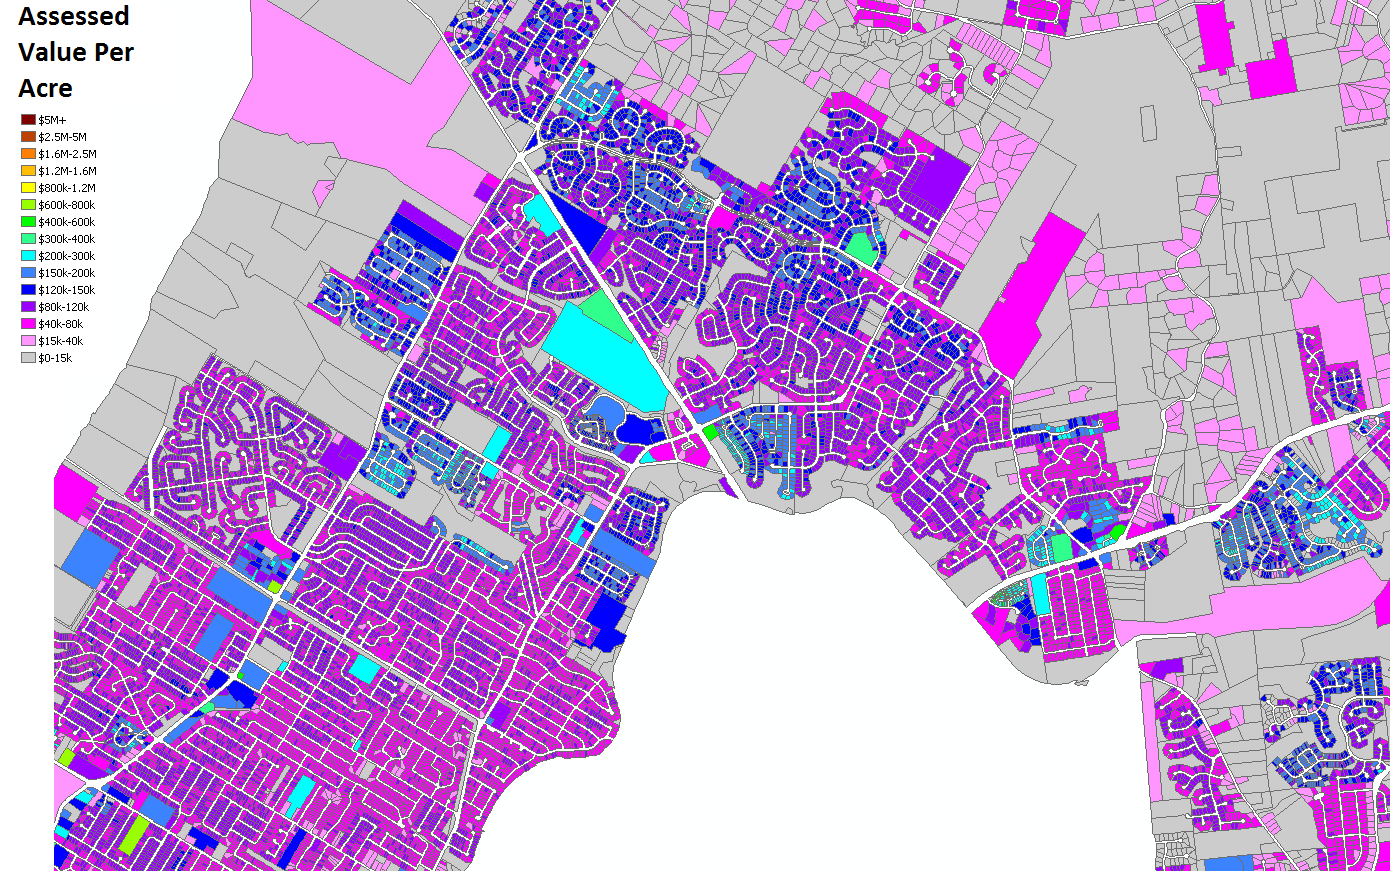 {North part of the district}
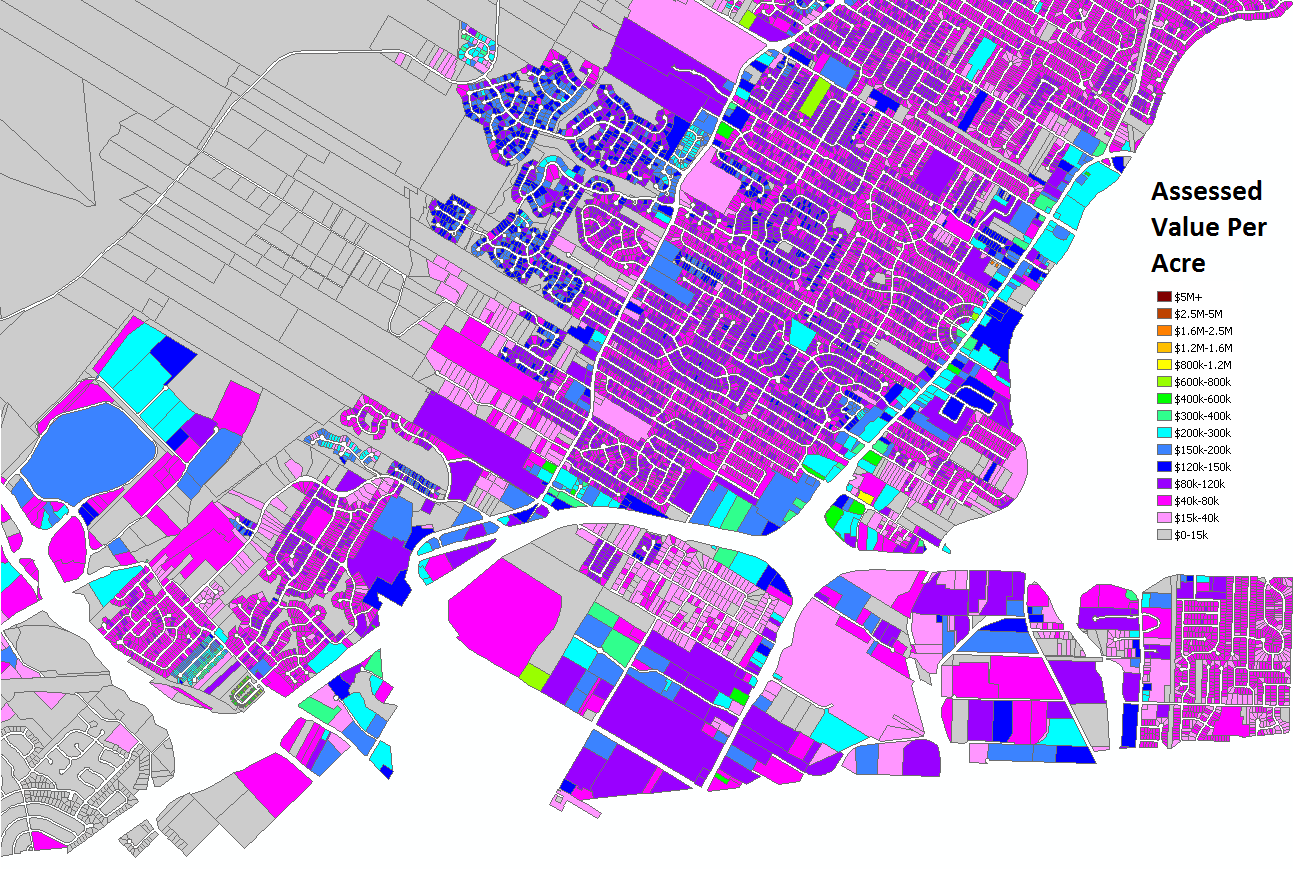 {West side of the district with I270, Hwy 370, and Lindbergh.}
Examining the assessed value per acre reveals a sea of low productivity. Bridgeton, Hazelwood, Florissant, Black Jack, and St. Louis County have been poor development partners of the school district. Built mostly after WWII the area lacks traditional development patterns. It was deemed obsolete. Federal, state, and regional policies and funding streams were set up to encourage what we see all over the district. Local zoning codes made traditional development illegal for it might be too affordable and attract poor and Black people. It all looked shiny and new, looked like success.
 {The only property to exceed $1M per acre in assessed value in the Hazelwood School District- Holiday Inn Express on Taylor Rd near Lindbergh – Google Streetview}
Today the area is in the second phase of the growth Ponzi Scheme wherein long term liabilities come home to roost, and the auto-oriented land uses can’t cover the costs for infrastructure and services. Debt piles up, maintenance is deferred, services are cut, taxes rise, subsidies to lure new development of the same sort dig a bigger hole.
The main realization for a school district is the cost of busing. HSD spends $7.5M, with $1.2M in state aid, per year on pupil transportation. Every dollar thrown away on busing can’t go into the classroom. Indirectly the costs of additional infrastructure, service delivery, utilities, debt service, and transportation crowds out wealth that could, in part, be going to schools.
Wide-lot residential and a dearth of traditional productive downtowns foretell a future of increasing financial difficulty for the school district and municipalities. Sprawl isn’t paying the bills. As Y chases X in a declining tax base it all spirals down to insolvency.
Another sign of trouble is the reconfiguration of Metro bus service to better cover the area. Transit serving spread out areas worsens the system as serving extent crowds out frequency (aka convenience, freedom). It’s Metro’s fastest growing market. Transit needing to serve sprawl is a symptom, not a treatment.
The sprawl ball keeps on bouncing. Our unwillingness to change policies in place will guarantee more of the same. It works well for those riding the wave outward, but those left behind face an uncertain and fragile future.
