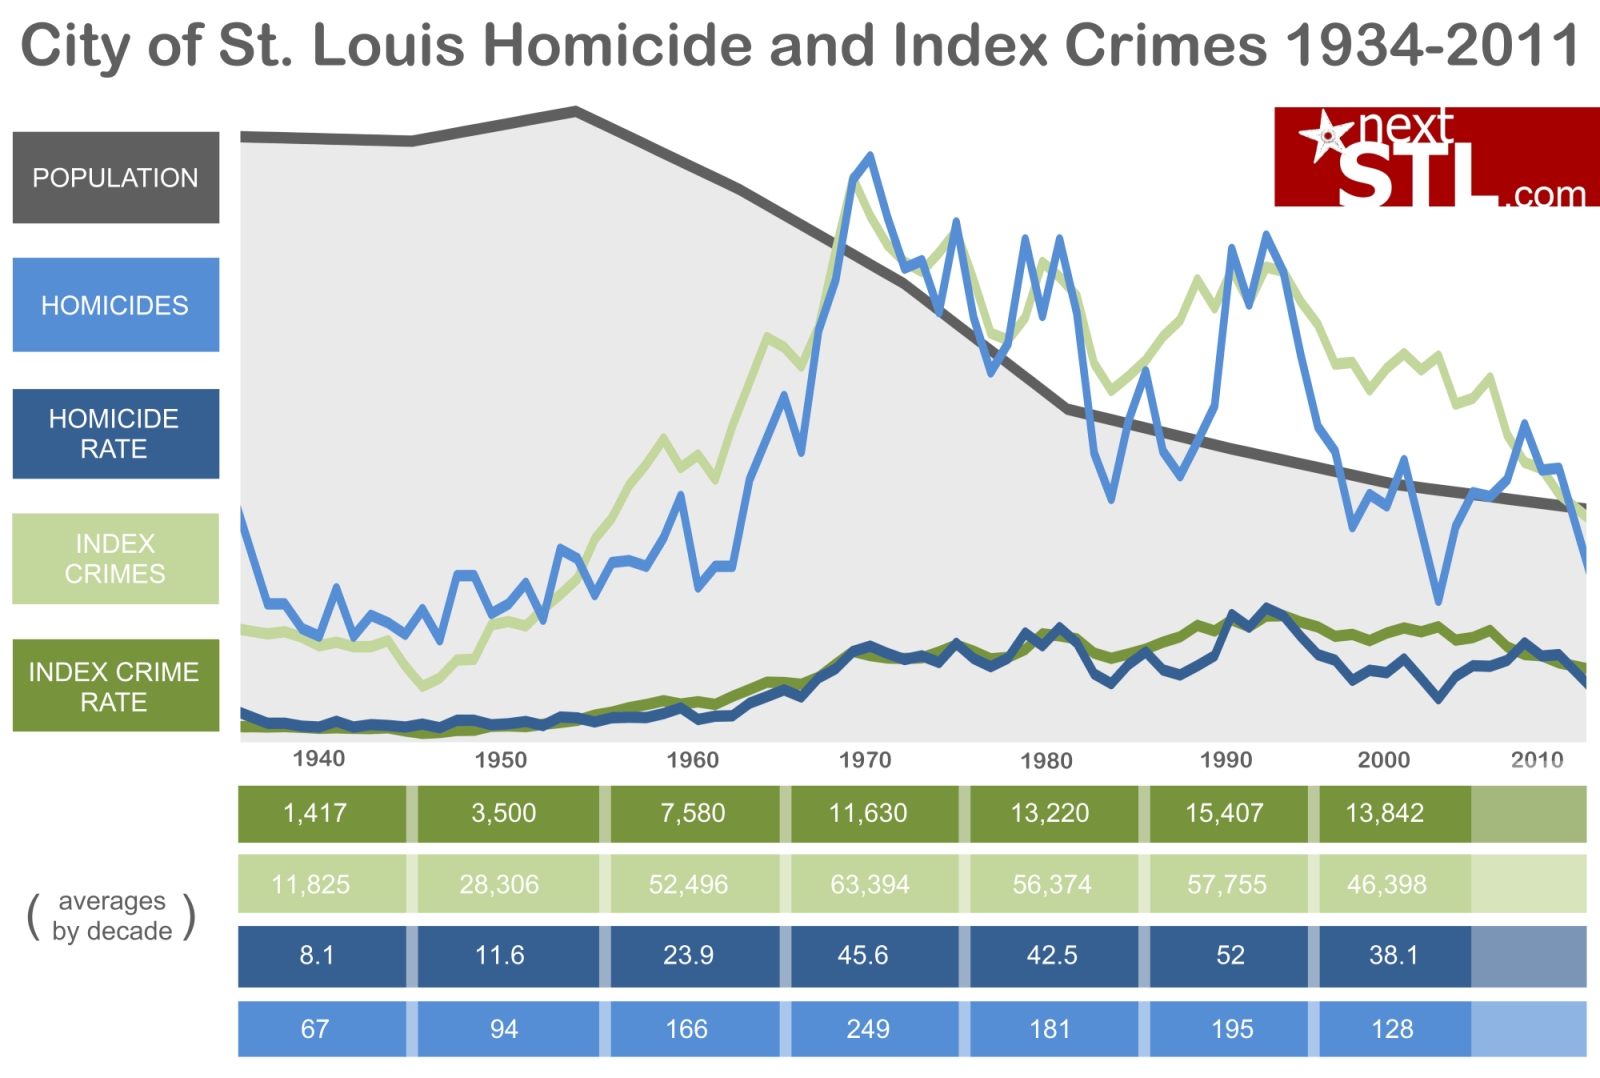

There’s been quite a lot of talk lately about crime in the City of St. Louis and using arbitrary dates and measures to claim the city is becoming safer, or not. The nextSTL City of St. Louis Homicides by Neighborhood 2005-2012 map showed that while many city neighborhoods are very safe, many are not and that homicides in particular are heavily concentrated in north city. Perhaps it’s instructive to take the long perspective? The above graphic shows homicide and index crime counts and rates per 100,000 residents from 1934-2011 (full data table including 2012 below).
What does it show? The 1960’s and 1970’s were a terrible time for crime in the city, as it was for just about every city in the nation. Rates and counts climbed to historically high levels. And while the raw numbers fell in the later 70’s and in the 1980’s, so did the city’s population and crime rates generally increased. The mid to late 80’s saw rates fall again, before sharply rising in the early 1990’s. Where the city sits now is somewhere between the post-1967 historic highs and lows.
To take a closer look at the past decade in St. Louis, specifically, Mayor’s Slay tenure beginning with his first full year in office (2002), through 2012, we see mixed numbers. Index crimes have continued to drop to a substantial degree, as has the index crime rate. The five worst years for index crimes in the city were the mayor’s first five full years in office. Homicides show a slightly different story, with four of the five worst years being 2007 to 2010. The 2011 and 2012 numbers (there were 113 homicides in the city in 2012) have returned to a level similar to the mid-2000s. Calculated rates for 2011 and 2012 assume a population loss of ~0.9% per year, the rate of loss experienced over the past decade.

Data table for 2002-2012:

Data table for 1943-2012:

As the result of a comment from a reader, I’m included a very basic measure of ttrends in a handful of cities. The graphic is a snap shot of one posted on the Atlantic Cities blog. I’ve added St. Louis as it was not originally included. The graphic below shows the annual homicide rate during each city’s peak year, in 2001 and in 2010 and the bottom graphic show the annual homicide rate for the US from 1960 to 2011 (from the same Atlantic Cities post).


