 In the month since the release of the redistricting census data results, a series of narratives have coalesced. While the overall story of St. Louis in the past decade has been one of continued decline, there are at least three distinct stories buried in the numbers. Using spatial mapping we can begin to untangle these narratives and consider their implications for the future of the city.
The first is a grassroots resurgence. Since 2000 a cohort of neighborhoods have seen a decrease in crime, increased rates of rehabilitation of existing units, the introduction of new businesses in formerly boarded-up storefronts and an influx of new residents. The neighborhoods range from Benton Park to Old North St. Louis but all have succeeded by combining a concern for quality of life with the promotion of distinguished urban character and have taken advantage of close proximity to physical and cultural amenities to attract new residents.

{Fox Park – just one of the resurgent neighborhoods to lose population in the last decade}
For many of these newly resurgent neighborhoods in the near-South Side, the reaction to the 2010 Census was shock. Initial estimates show population decline for a belt of neighborhoods running from Benton Park to Clifton Heights in the 10-20% range.

These neighborhoods saw a simultaneous population decline and notable increase in property value; while household income numbers are not yet available, notable increases are expected. As discussed ad infinitum for the past several weeks, the explanation was attributed to the replacement of larger, poorer families with smaller and more affluent families. These replacement dynamics should be evidenced in change in average family size and change in number of household units. The redistricting Census, the numbers released to-date, give us the number of units and total population for all census tracts, making it possible to compute these changes in comparison with the 2000 Census. Since Census tract boundaries do not correspond with neighborhood boundaries, neighborhood boundaries are indicated in purple.

By examining the change in the number of housing units across the near-southside, it is possible to attribute a small part of the recorded population loss to consolidation of smaller units into larger apartments or condominiums. However, the loss of units in neighborhoods such as Tower Grove East or Shaw is commensurate with the loss through consolidation and demolition throughout much of south St. Louis. Therefore, the factor most likely to cause the recorded population loss is a marked decrease in family size.

A cursory examination of the change in household size over the past decade supports the anecdotal hypothesis. A large area stretching from Benton Park to Kingshighway experienced a 10-20% decrease in average household size. While large-scale abandonment of units may skew averages derived from the ratio of population to units, vacancy levels throughout this area have remained relatively stable. It is clear that social composition is notably changing in these areas. That social change correlates to new populations and greater levels of affluence. While a pronounced increase in household income is more than able to offset the resultant loss of density from a business perspective, decreasing density remains a concern for issues such as sustainability and public transit.
A second story is prolonged decline and population collapse. The story is starkly different for an equally large belt of neighborhoods located on the near-Northside. These neighborhoods, stretching east to west from Hyde Park to Wells-Goodfellow suffered greatly from rampant blockbusting and were eviscerated by the subsequent loss of the majority African American upper and middle classes to the suburbs. While the impact of FHA redlining is frequently cited as the primary reason for the decline of these neighborhoods, a similar number of resurgent neighborhoods on the South Side were also redlined.
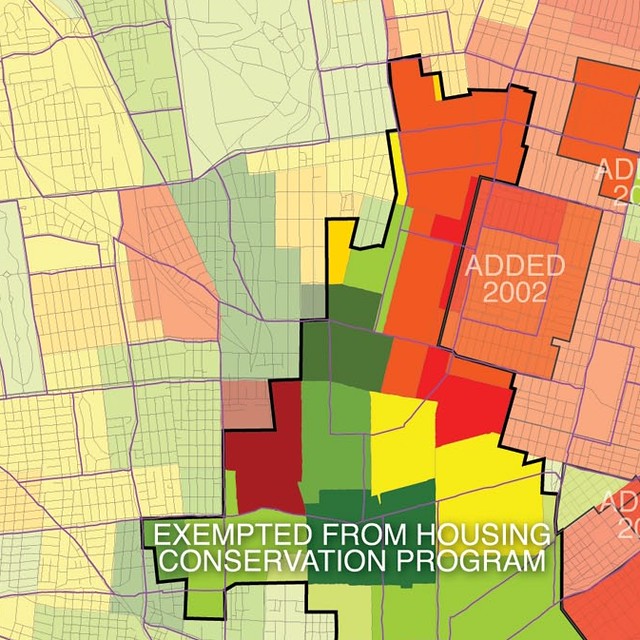
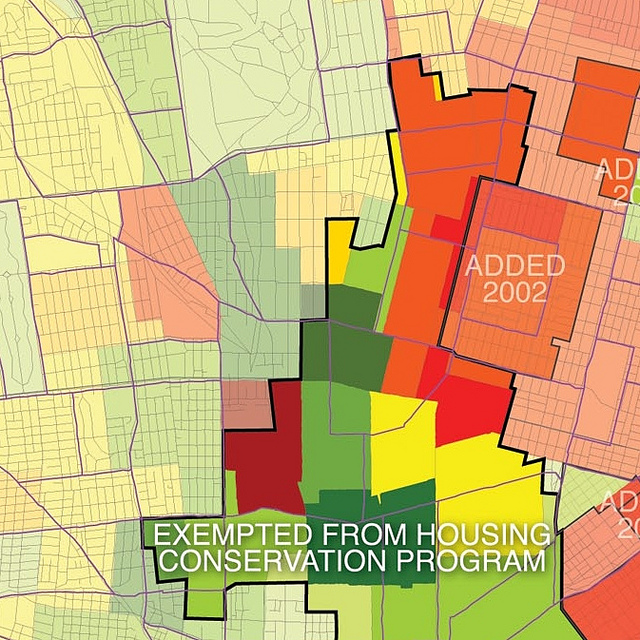
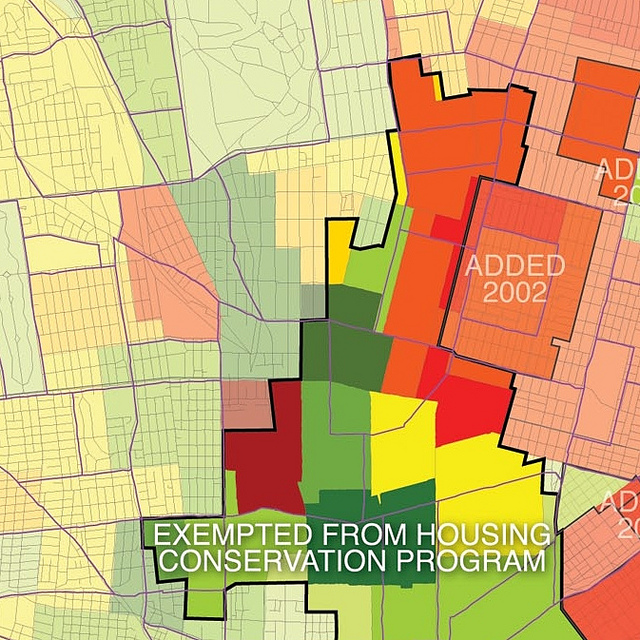
More damaging than redlining may have been the exclusion of these neighborhoods from the Housing Conservation program. Established in 1986, housing conservation seeks to maintain a minimum standards of safety, security, occupancy load, and sanitation. In areas exempt from Housing Conservation, occupancy permits are not required and occupancy standards and internal building conditions are not regulated. Furthermore, condemned buildings may be re-inhabited as long as exterior problems are remedied
While only a quarter of residential units in the city are currently exempt, the majority are on the near-Northside. By overlaying districts exempt from Housing Conservation, districts added to Housing Conservation recently, and population decline, it is clear that ongoing population collapse is partly attributable to substandard housing conditions caused by the failure of City of St. Louis Aldermen to join the Housing Conservation program.
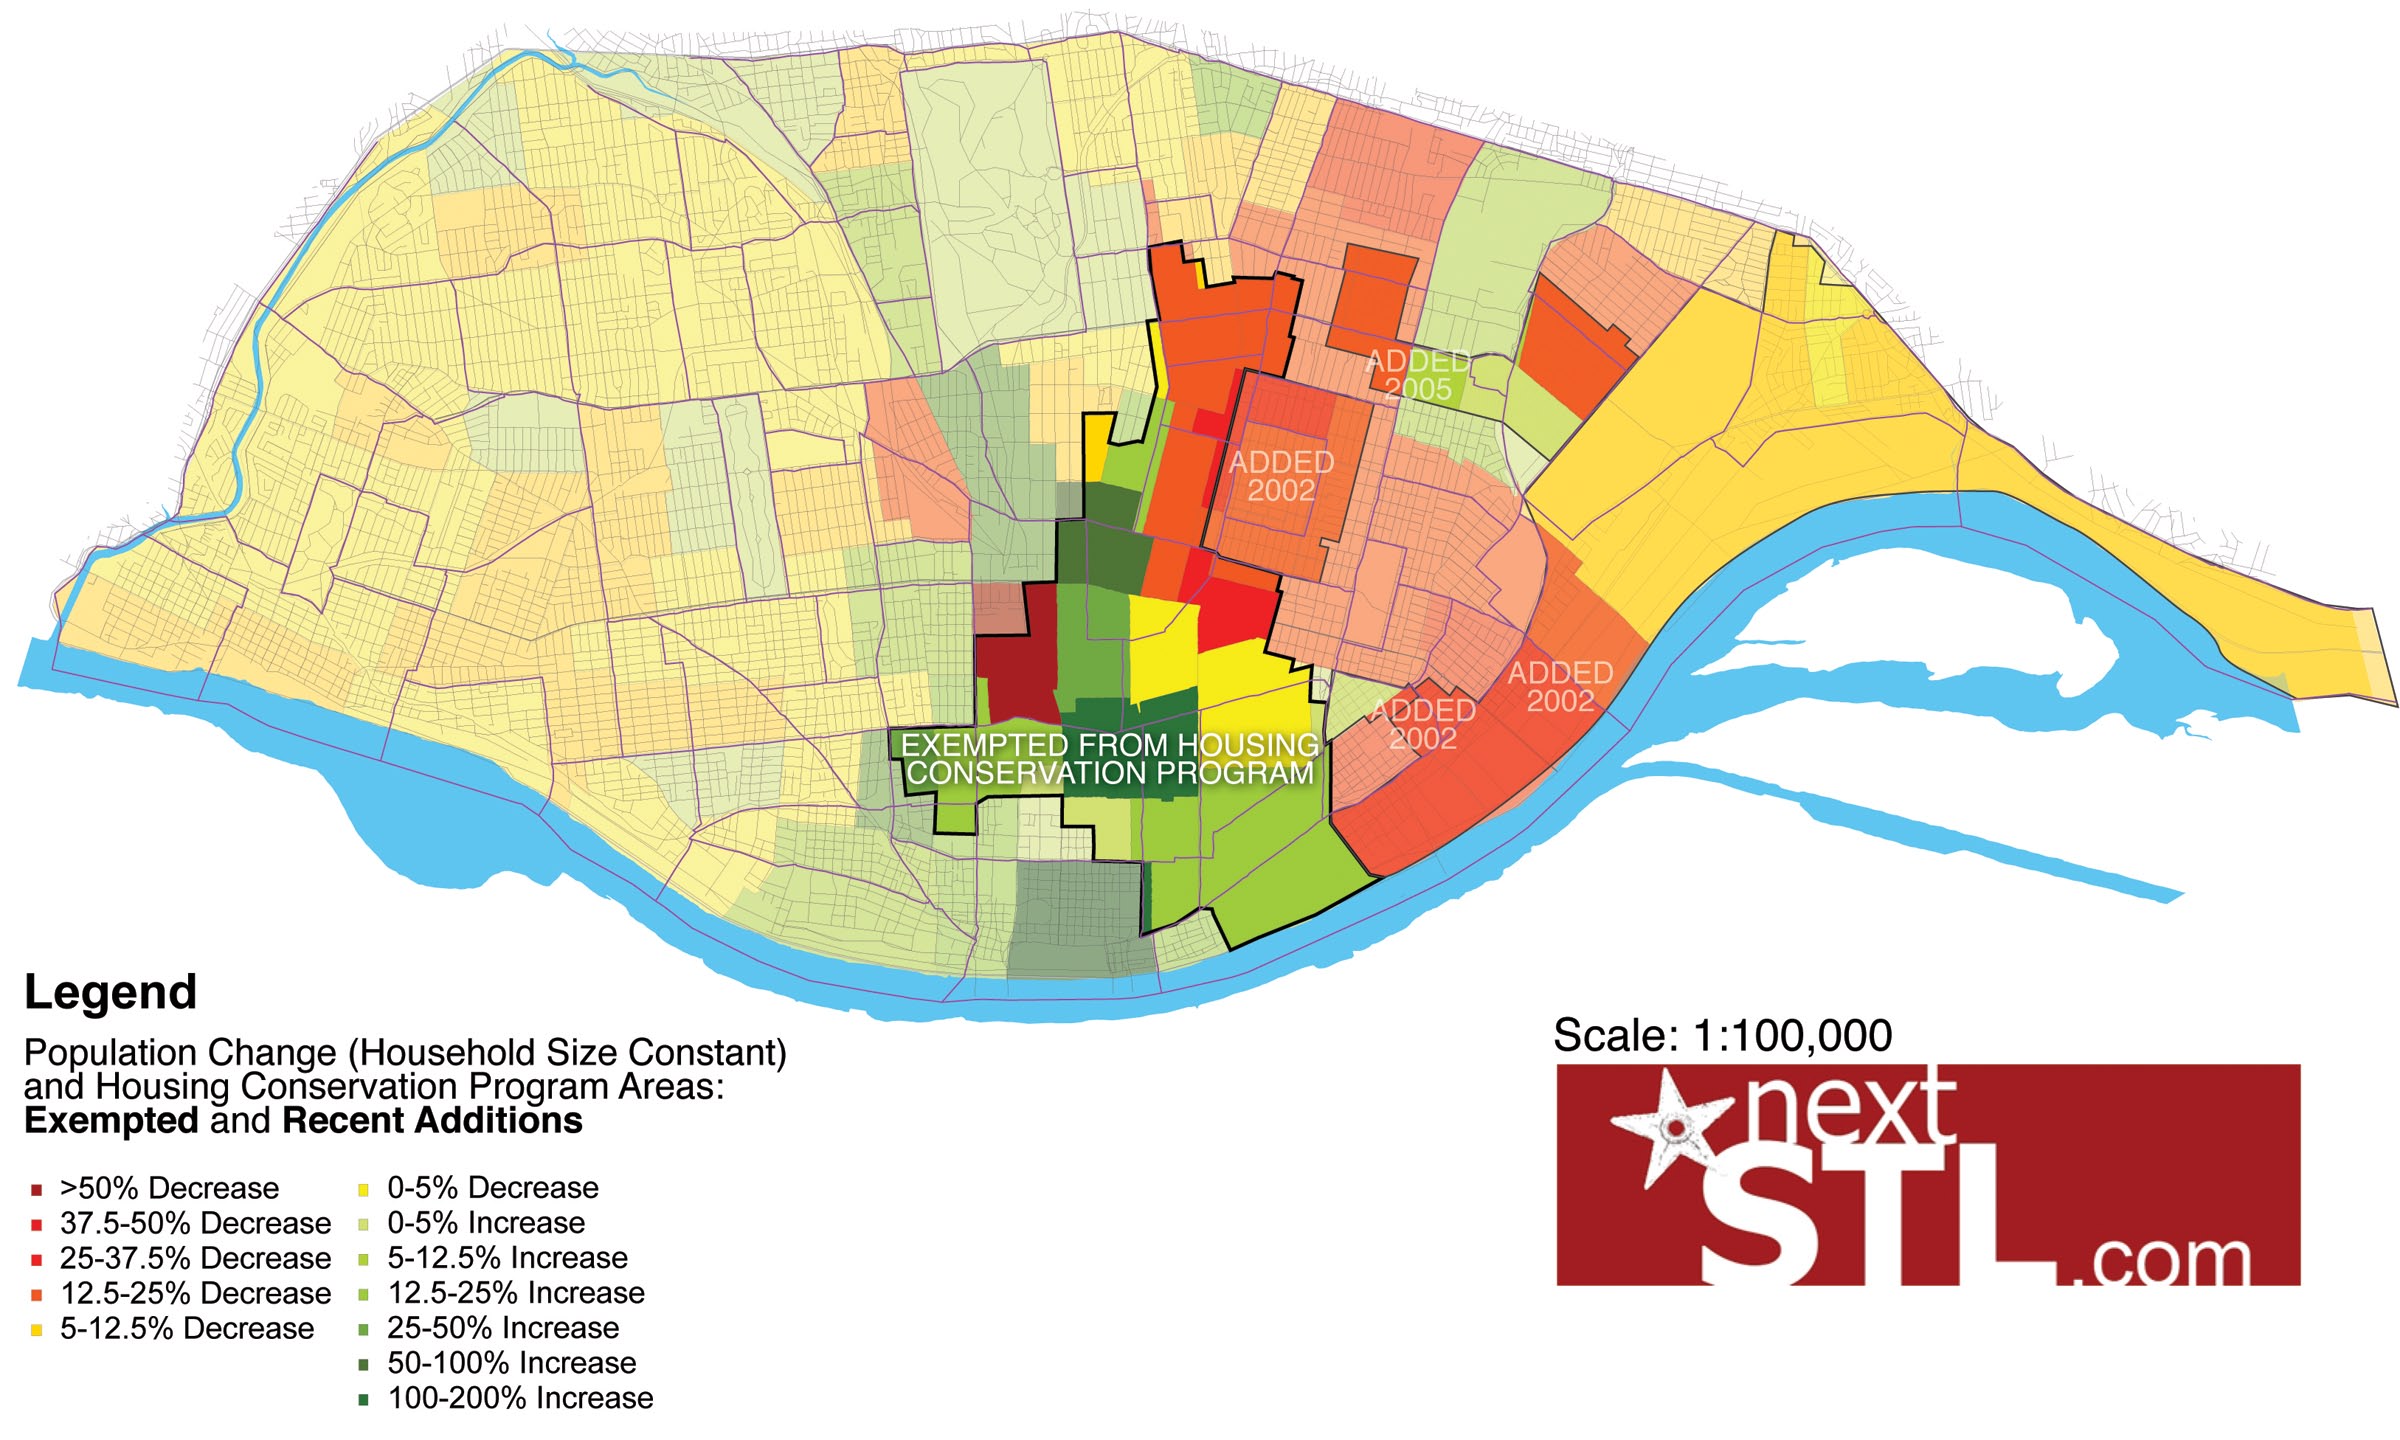
The relative anarchy of building conditions has depressed home values and has taken a severe toll on the housing stock through exploitation by absentee landlords, apartment overpopulation, and illicit interior renovation. Depressed values led to the abandonment of the area by the African-American middle class in mid-1970’s and the African-American working class soon after. What we see today is a combination of the desertion of these neighborhoods by the poor and the effect caused by the passing of aging-in-place senior citizens coupled with virtually no in-migration. In the next decade the population is likely to consist ever more of only those who cannot afford to leave whether truly disadvantaged or extremely poor seniors.
A third narrative is centripetal dynamism. While the first story focuses on collective effort and the second focuses on governmental neglect, the third is characterized by the convergence of centralized finance and governmental effort. Amid the disappointing 2010 Census results, the positive story of growth downtown and in the central corridor has been downplayed. The central corridor, stretching from downtown to the city limits between I-64 and Delmar has historically received the vast majority of federal, state, and local subsidy for redevelopment. While this is unfair from a spatial perspective, the result is a corridor that now includes the largest employer in the metropolitan region (Barnes-Jewish Hospital/Washington University Medical Center), nearly every major civic institution in the city, and the majority of transportation investment. In this light, further investment is an inevitable product of maintaining the vast existing investments and established vitality in this area.

When Census 2010 population figures are adjusted to take into account the reduction in household size throughout the city, the central corridor and immediately adjacent areas come into focus as drivers of residential growth, and that growth has been exceptional. The 253% residential growth downtown (for these purposes including Downtown West) has emerged on the back of over $4 billion invested due to the Missouri Historic Tax Credit and almost a billion dollars of investment in new construction during the last decade. (The Economics of Historic Preservation report PDF)

{The Bogen is just one of many loft developments that resulted in downtown residential growth}
The investments in tax credits, Tax Increment Financing (TIF), and other vehicles may have oversupplied the market in specific neighborhoods. The Census showed that downtown has a 34% residential vacancy rate. Taking into account the number of units currently vacant with the average household size as well as the impending completion of the Park Pacific and other projects, downtown currently has enough capacity to add 2,700 residents. To reiterate: there is enough current capacity in downtown to accommodate five years of growth at current rates. This does not mean a cessation of current strategies, but a refocusing on residential amenities and quality of life in order to overcome current rates of vacancy.
The third part on this series will examine strategies to position St. Louis for the next decade.
Census map images are available in PDF format as well:
2010 Census Maps of St. Louis by nextSTL
