 There is one typical question frequently asked of any urbanist. Its permutations may differ, but few cocktail parties, power lunches, or bleary-eyed salons are without someone speculating on a magic bullet to save the city. In the case of St. Louis the magic bullet is simple: more people.
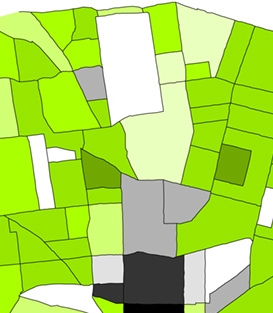
 There is one typical question frequently asked of any urbanist. Its permutations may differ, but few cocktail parties, power lunches, or bleary-eyed salons are without someone speculating on a magic bullet to save the city. In the case of St. Louis the magic bullet is simple: more people.
This is the first of a multi-part series to examine the 2010 United States Census Redistricting Data in the context of the past ten years and seek to understand where we are today, what we can learn, and how we can position ourselves for the next decade.
With a background in urban design, it would be natural to critique the suburban-style low-density development that has mushroomed throughout the urban fabric in the past twenty years, but instead, I will focus on people, the residents.
The city inevitably fails to be a city when it tries to “do suburbia”, but that is a topic for another conversation. What is pertinent is that the demand and market conditions for density do not exist at this point in the majority of St. Louis’s 79 neighborhoods. Urbanists can bemoan strip mall infill projects, auto-centric development, and rampant demolition, but until we reshape the economic and political reality of the city such concerns will not lead to action.
Initial reaction to the population losses of resurgent urban neighborhoods of the near-southside was shock. This quickly formed into a dogmatic thesis that smaller, wealthier families in redeveloped neighborhoods account for the 10-20% population decrease across the near-Southside.

What is more concerning is the continuing loss of population density. By using the census population counts and the area of the neighborhood, the continuing loss of population density becomes clear.

While many debate whether population declines are attributable to smaller families replacing larger families in revitalizing neighborhoods, whatever the cause, the resultant decrease population density remains undisputable. Although lower–income neighborhoods typically require more intensive social service provision, the provision of basic services such as roads, water, sewer, electricity, and gas do not change with socio-economic status. Whether the loss is due to abandonment or two people living in a building previously inhabited as a four flat apartment, the cost of maintaining basic services will escalate with fewer inhabitants.
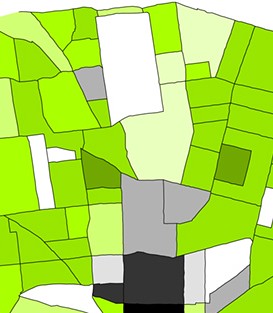
This condition becomes even more stark when public transportation is taken into account. Several established benchmarks determine minimum population densities for effective transit service. For minimum service of one bus per hour on a half-mile route spacing, four occupied dwelling units per acre are required (source). Using the average household size in St. Louis of 2.2 persons per dwelling, almost a third of St. Louis’s residential neighborhoods have lost the density required for minimal bus service.

This map is based solely on residential density criteria, so neighborhoods such as Downtown, Midtown and the Central West End possess a sufficient employment base to counteract lower residential densities and anchor efficient transit service. These neighborhoods have been demarcated with heavy borderlines on the map. In addition, this represents the density of the neighborhood population spread across the geographic boundaries of the neighborhood; places with small pockets of density may be viable transit nodes but will not be represented on this map with a neighborhood-level analysis.
Caveats aside, if access to efficient transit is essential for an urban setting, there are still more than twenty neighborhoods that can no longer be classified as urban neighborhoods due to prolonged and severe loss of population density. Urbanism and urban potential are predicated on density, not history. We have to understand the present reality of post-urbanized areas clearly before we can hope to successfully address the future of urbanism in St. Louis.
If smaller families are indeed replacing larger families in revitalizing neighborhoods, it is possible that there will be reduced demand for consistent transit usage as new arrivals choose to work from home, or commute by bicycle or car. This subject needs further investigation through survey and fare box revenue before it becomes more than conjecture.
Part II will examine three differing stories present in the 2010 census data and examine closely the explanation of population loss as a result of smaller families replacing larger families and single-family rehabs replacing multi-family residential units.
