
So someone figured out that giving a metro region of city a blanket crime ranking (or even better, a danger ranking) doesn’t tell someone much. It’s clear enough that cities from Fort Wayne, IN to Seattle, WA have safe and less safe neighborhoods. You can click here for the full methodology, but basically this company divided the number of neighborhood residents by the number of violent crimes (murder and non-negligent manslaughter, forcible rape, armed robbery, and aggravated assault) which occur in that neighborhood.
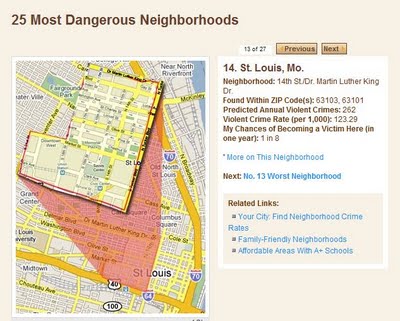
By this measure the most dangerous St. Louis neighborhood ranks 14th. Kansas City boasts #6 AND #8. Chicago can be found four times in the top 25 while Springfield, Il, Little Rock, AR and Orlando, FL make appearances. There is plenty of room to challenge, discuss and further explain what this list shows and doesn’t show, but I am going to point out two issues:
1) Does it increase the likelihood of a resident becoming the victim of a violent crime if a visitor to a neighborhood is the victim of a violent crime? What if an area has very few residents but a high concentration of nightclubs?
2) If a resident is the victim of multiple crimes in a given year how does this affect the chance of a resident becoming a victim?
On the surface the numbers seem off. The “Most Dangerous Neighborhood” in the nation is listed as a part of Cincinnati known as Over-The-Rhine. To be sure, there is violent crime there, but does a resident really have a 25% chance of being a victim of a violent crime in any given year? I doubt it.
The other problem is that a casual observer may conclude that if a resident has a 1 in 4 chance of being a victim of violent crime in one year that if you were to live there for 4 years you would certainly become a victim. Clearly this isn’t correct.
But the most insidious part is that neighborhoodscout.com suggests that their numbers should be purchased and used by commercial property developers, marketers, retail operators and insurance providers to “to determine the underlying characteristics of a neighborhood’s commercial viability or demographic appeal prior to investing in a project or opening a retail location.”
Luckily here in St. Louis City many fine businesses have apparently ignored the dire numbers and are trying to make a go of it. There are even some upscale restaurants and a few national retail chains! Incredibly brave they are. Looking at the map below may lead one to conclude that one would have to be clinically insane to locate their business in the City. I’m just happy that Progressive remains willing to insure my Honda Civic in such hostile territory.

{map showing relative safety of St. Louis neighborhoods}
