
Many of the municipalities in the region are failing or stagnating. The failing ones are easy to spot. They can’t feed their prisoners. The mayor is caught embezzling. They use speeding tickets to fill budgets. Their population is dropping. Wealth is fleeing. Empty housing, retail, offices, and factories dominate. These are the apparent signs.
What is less obvious are the ones stagnating. Their populations aren’t growing, their land is built-out, their housing stock and population are aging. A mall dying, a big box leaving, or a declining school district could send them into a downward spiral. Popular perception may be a healthy one, but let’s look closer.
I’m using numbers from Ellisville, not to pick on them, they are heroes in my book for fighting the temptation of a TIF, but because they share useful data. A pitfall of transparency, I suppose.
Ellisville has 9,143 residents (up 39 from 2,000, 22nd largest in St. Louis County, smaller than a city ward, which average 11,000) spread over 4.39 square miles. The median age (That is half above, half below) in 2010 was 44.7 years (39 in 2000). Median household income is $66,832 ($65,016 in 2000). It has a high home ownership rate of 84.7%. The picture of stability and the envy of many.
But wait, the median income number is in nominal dollars. Let’s take into account inflation. $65,016 in 2000 is $82,329 in 2010 dollars. Household size in 2000 was 2.84 and in 2010 was 2.52, which may account for some of the decline. It is still higher than the median income in St. Louis County at $58,485.
Let’s see how the municipality’s revenues have fared recently. See the document below for a full rundown. I’ve displayed the Real Estate Tax (3.65% of total revenue), the 1% Sales Tax (22.66% of total revenue), and the 1/2% Stormwater Sales Tax (13.8% of total revenue). I’ve normalized them to their 2004 amounts so we can see how they’ve changed relative to each other. Ellisville is a Point-Of-Sale city.
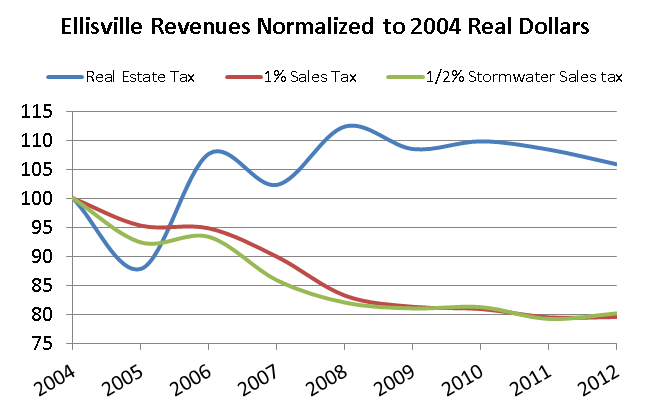
Property taxes have been volatile, but have beaten inflation. Sales tax collections have fallen precipitously. In addition to the two sales taxes displayed, Ellisville now has a 1/2% Capital Improvements Sales Tax (added in 2011) and a 1/4% Parks Sales Tax (added in 2007). These four together raise 53.8% of Ellisville’s revenue. Had they kept up with inflation, they would have raised 20% more in 2012. No wonder they’ve added two new taxes recently. The prices of things have kept up by definition, but the total amount sold in Ellisville has not.
This reveals how the reliance on sales taxes has left Ellisville vulnerable, and why a new Walmart was attractive to many, no matter the subsidy offered. Vulnerable to Internet sales, vulnerable to shifting consumer habits, vulnerable to the TIF wars, vulnerable to the transportation and housing subsidized hyper-horizontal development pattern. I suspect a similar story could be written for many of our cities (Sales taxes are 44% of Crestwood’s revenues down from 56% in 2006, down 33% in real terms or $2.9M). They are in a much weaker position to deal with municipal challenges, let alone meet the usual delivery of basic city services. For example how can a city bond out a project backed by general revenues if there is risk that a big box closing puts a huge hole in receipts?
Ellisville’s per capita income in 2012 was $40,263, or $368M for the entire city. In 2000 it was $27,379, $36,504 in 2012 dollars, or $332M for the entire city. If Ellisville had the dreaded and now banned Earnings Tax, revenues would have grown 10.8% over inflation 2000-2012, and they might be lowering other taxes instead of raising them. I’m leaving out the fact that had Ellisville had an Earnings Tax it would clearly be a horrible place to live, and everyone would have left by now, so any revenue projections are suspect (as many Earnings Tax opponents would have us believe). *Numbers are from census data which have big error bars. The IRS says per capita AGI for ZIP code 63011 is $38,959 and for 63021 is $37,657. These ZIPs cover Ellisville and more, 92,600 residents in all.
What to do? The Super Mega Merger may not be the answer, but neither is the status quo. I encourage municipalities like Ellisville to examine their revenues similarly and promote local, regional, and state development and taxing policies that would render them more resilient, instead of hanging on the whim of a national retailer, or slowly sliding into financial crisis.
A Strong Towns post The Problem with Sales Tax
