
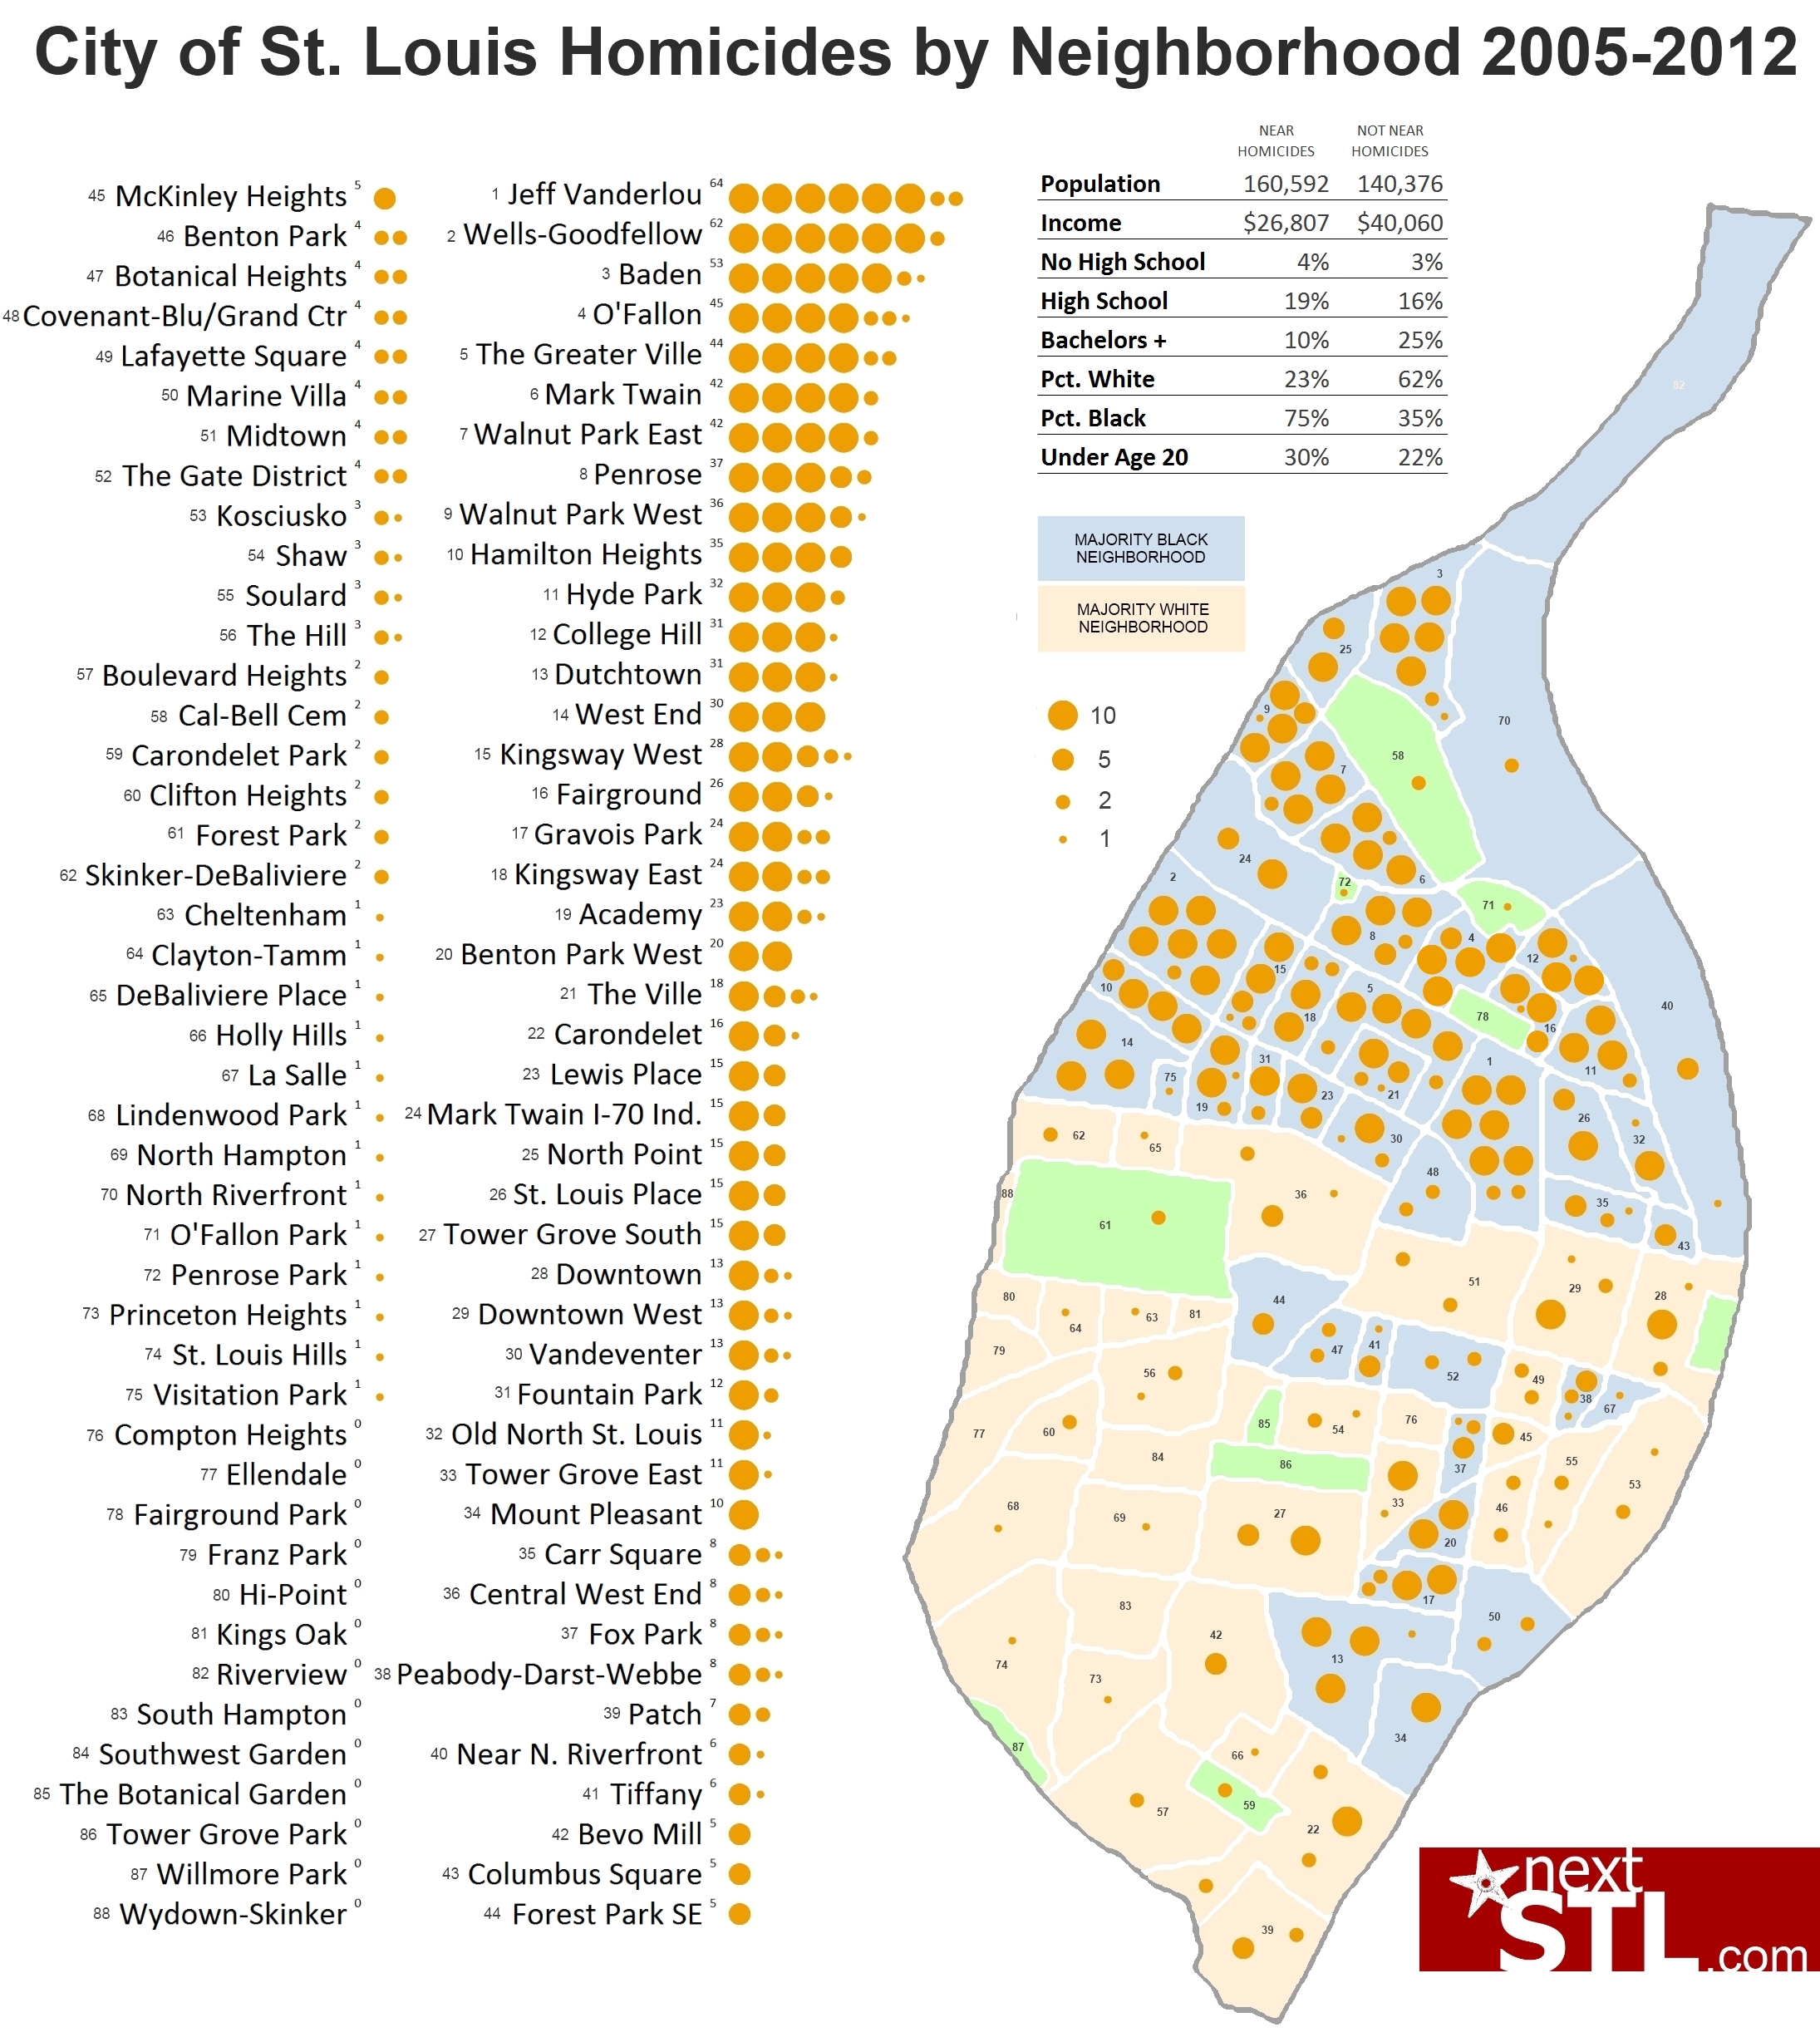
The graphic above is meant to nominally mirror the one created by the NY Times and titled “A Chicago Divided by Killings“. There were 506 killings in Chicago in 2012, a 17% increase over the previous year and the second highest annual total since 2003. Twenty-first Ward Alderman Antonio French Tweeted a link to the Times’ graphic and stated that it would interesting to see a similar map of St. Louis. I agreed and figured I’d give it a shot.
The premise of the Chicago item was that killings there followed that city’s racial divides. The St. Louis map would seem to show very much the same. Race, income and educational attainment are closely aligned in neighborhoods across the city. The divide is so great, that in the “near homicides” neighborhoods (the 20 in which there were 20+ homicides over this period), the average homicide rate is estimated at 57 per 100,000 residents, while the rate in the “not near homicides” neighborhoods (the 20 that saw 0 or 1 total homicides) is estimated at 1 per 100,000 residents. There are more than two St. Louis’s, but there are certainly two incredible extremes in the city. Still, the most stark numbers may be the victims. Of the 567 homicides from 2008 to 2011, for which the race of the victim is available in the SLMPD annual reports, 502 are listed as black, while 64 were white. Over that period, 89% of those killed in the city were black. In a city that’s very nearly 50/50 black/white, those 64 homicides would give an annual murder rate of ~10/100,000 for white residents and ~78/100,000 black residents.
Notes: Homicide data is taken from end-of-the-year reports available on the Metropolitan Police Department website and cover January 2005 through November 2012. Racial composition of neighborhoods uses 2010 Census data and economic and education measures rely on numbers from the American Community Survey. The measure of “near homicides” includes the 20 neighborhoods that saw 20+ homicides over the dates covered. The measure of “not near homicides” includes the 20 neighborhoods that saw zero or one homicide over the same period.
*This graphic was updated on 1/7/2013 to reflect corrections in several neighborhood homicide counts. The largest changes occurred in the neighborhoods of Clifton Heights (12 to 2), Ellendale (8 to 0) and O’Fallon (29 to 45), as well as several city parks. The errors were the result of neighborhood name changes that resulted in misaligned tabulations. The corrections have enhanced the disparities apparent in the map, most significantly increasing the homicide rate per 100,000 black city residents from 53 to 57 and decreasing that of white residents from 2 to 1 per 100,000. The old map and revised verision can be seen together here.
All data used to produce the graphic and associated numbers above can be found here.
