
 In the first City of St. Louis mayoral candidate debate, three-term incumbent Francis Slay stated that while “the ‘Delmar Divide’ is real”, that “on a block to block basis we are one of the most integrated cities in America.” The claim received an audible response of disbelief from some in the audience and was met with derision across social media, including myself. It just sounds wrong. A 29-second video clip was quickly posted to YouTube by an opponent of the mayor.
A good part of the mayoral contest so far has related to this divide, whether it’s the location of crime in the city, the delayed opening of the north side recreation center, or the mayor visiting a neighborhood meeting. It’s hard to avoid the issue. However, the focus of this article isn’t whether or not the city is in fact integrated or segregated, but rather understanding different ways to attempt to quantify the issue.
St. Louis is a racially divided city. This is what one is told when moving here. It’s what one is told growing up here. But is it true? And compared to where? So St. Louis often appears on lists of America’s most segregated cities (here, here, and here). The rankings are generally accompanied by a lament of just how little progress has been made in the nearly six decades since Brown v. Board of Education, then the Civil Rights Act fourteen years later.
What exactly are the numbers used to rank cities measuring? It’s something called the “Dissimilarity Index”. In this case it’s a measure of the degree to which blacks are distributed differently than whites across census tracts. It uses a scale of 0-100 and the value indicates the percentage of blacks who would have to move so that each neighborhood reflects the racial composition of the city as a whole. The degree to which each race is not equally distributed across a city is the Index of Dissimilarity.
This is a measure of black resident distribution against white resident distribution. For instance, a city with five census tracts in which each tract includes 5 white residents and 5 black residents would be judged to be perfectly integrated, a score of 0 (assuming a city of ~50/50 black/white residents). If one of those black residents moved to another tract within the city, the score would then be 20. If all 25 lived in the same tract, 80. All popular “most segregated cities” rankings use this methodology. In addition, this measure uses Census definitions for race. All individuals identifying themselves in whole or in any part as black or African American are considered black. Only those white persons with no other racial identity are considered white.
The critique, from the study examined below, is that the Dissimilarity Index is a “racially-biased approach based on a white majority view of segregation.” It’s an approach that looked at segregation through the lens of white flight and racial “tipping points” for neighborhoods and blocks. The 72.4 Dissimilarity Index for the City of St. Louis (2000 Census) means that achieving a “fully integrated city” would require 113,784 black city residents to move out of their neighborhoods and into majority white neighborhoods. Ranking cities by the degree to which the black population is evenly dispersed, with the goal being to have the same black to white ratio in every neighborhood is clearly biased and flawed.
So is the Dissimilarity Index an accurate gauge of segregation in our cities? Researchers in Milwaukee, often ranked as the nation’s most segregated city, thought maybe not, and introduced the Integrated Block method that takes a different approach. This is the study Mayor Slay is referencing when he says that St. Louis is one of the most integrated cities in America. Instead of seeking a perfectly even distribution of blacks and whites across a city, it posits that an 80 percent white and 20 percent black population should be considered integrated for a residential block. Likewise, an 80 percent black and 20 percent white population is considered well-integrated by this measure.
Another way to state this is to say that if a block has at least 20% black and 20% white residents it is considered integrated. This approach asks what portion of city resident live on mixed blocks. If a city has very few black residents, it will have very few of these blocks. And so while the black population of Chesterfield, MO may be integrated by the Dissimilarity Index, many fewer Chesterfieldians live on a block that is 20% black. Is Chesterfield integrated? Is St. Louis? The Dissimilarity Index shows the Chesterfields and Ballwins to be quite well integrated, to an incredible degree more than St. Louis (Dissimilarity Indices: City of St. Louis, 72.4. Wildwood, 22.1. Chesterfield, 22.4, St. Charles 35.7). The Index is saying, “the black residents we have are well dispersed.” Mayor Slay’s contention that St. Louis is one of the best integrated cities understandably raises more than a few eyebrows. However, the Dissimilarity Index clearly fails to understand St. Louis.
A quick side note regarding why this matters at the macro level (and not just in the St. Louis mayoral race): From the study: By ignoring racial integration occurring in the large urban centers and focusing on dispersal of small African American populations in suburban and exurban areas of metropolitan counties, press coverage of the historic segregation index rankings reinforces the latest anti-urban legend that the nation’s predominantly white suburbs and cities with very small black populations are the most successful models for black-white integration growth in the 1990s. A recent study on black-white segregation used the index to conclude that, the decline in segregation comes about primarily from the integration of formerly entirely white census tracts. Areas that are nearly all non-black are considered least segregated when their small black populations are dispersed. Meanwhile, the racial integration occurring in the major cities of the Midwest is ignored with much of it considered segregation under the old indexes.
What does the Integrated Block method show? Among all major Midwestern cities, St. Louis has the highest level of black and white integration. Twenty-seven percent of city residents lived on integrated blocks (2000 Census). Nationally, St. Louis ranks fifth, only behind Jacksonville, Nashville, Charlotte and Virginia Beach. Among cities with near equal black and white populations, St. Louis ranks as the most integrated. The lowest level of integration in the Midwest was found to be in Chicago (6%). In general, the Midwest cities that dominate the “most segregated cities” rankings are among the most integrated using this method.
Why doesn’t this ranking of integration resonate with us? Here are five reasons: 1) we’re repeatedly told that we’re a segregated city. “Look, we made another Top 10 list!” 2) As a near 50/50 black/white city, there are large pockets of nearly all white and nearly all black residents. This is easier to see than integrated blocks. 3) Mapping where black and white residents live provides a stunning visual. 4) Promoting the “fact” that we’re segregated serves political purposes, providing a scapegoat. 5) The very real and powerful history of segregation in St. Louis doesn’t allow us to consider alternative evidence. Challenging this history is very difficult for individuals and a community.
What if a mayoral candidate addressed the issue this way:
“Segregation is a problem in our city. Any time residents feel isolated or marginalized it’s a problem. Any time a resident feels underserved because of the color of their skin, it’s a problem. Our city has near equal populations of black and white residents and many of us live in neighborhoods that are almost exclusively black or white. If we’re to be judged by this, the solution would be for thousands of our black residents to leave their neighborhoods and relocate. This is what many so-called segregated city rankings quantify as a solution. We love our neighborhoods, we’re proud of them, from O’Fallon to Patch and Downtown to Demun. What’s important is not that we rearrange ourselves into some homogenous mixture, but that we treat our residents and neighborhoods equitably.
“On another measure of integration St. Louis does exceptionally well. If we consider the number of residents who live on integrated blocks, those blocks where there are at least 20% black and 20% white residents, our city is one of the most integrated in the nation. Black and white, we live together as neighbors as do few cities anywhere. That’s something to take pride in. Now, that fact gives us an opportunity to be better, to act with kindness and understanding to one another and that’s what we should dedicate ourselves to doing.”
Perhaps that all doesn’t fit exceptionally well into a mayoral candidate debate.
 *data source Racial Integration in Urban America – UW-Milwaukee
 *data source New Racial Segregation Measures for Large Metropolitan Areas: Analysis of the 1990-2010 Decennial Censuses
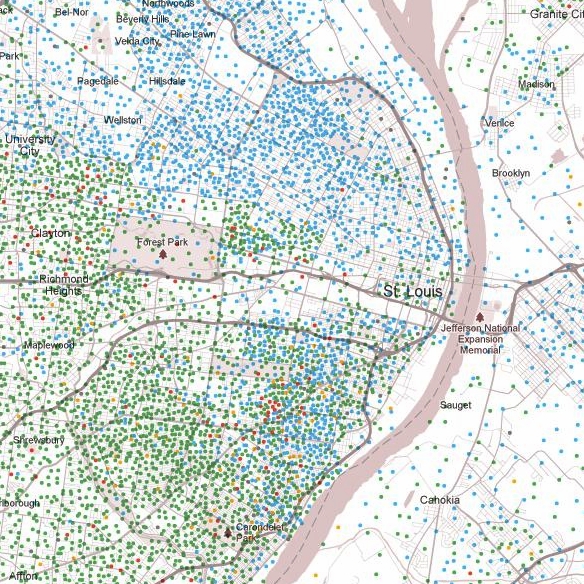
Mapping black and white residents provides stunning visuals. Do these skew our understanding of integration or simply reveal reality?


Racial Integration in Urban America: A Block Level Analysis of African American and White Housing Patterns in the nextSTL Scribd library
