
The 2010 Census isn't new news. Locally, the City of St. Louis lost another 28,895 residents, the sixth straight decennial loss. After growing to more than 850,000, today's St. Louis numbers fewer than 320,000. The decade's loss (-8.3%) was very similar to Pittsburgh (28,859 residents, -8.6%) and Cincinnati (34,340 residents, -10.4%). Despite the city's numbers, the story that should have sounded an alarm locally was St. Louis County's loss of residents for the first time in its history. The county is the ~1,000,000 person heart of the region. Its unprecendented loss was generally greeted with a collective shrug and a denial by the "healthy" municipalities (there are 90) that there's a problem. While the Census itself is no longer news, new ways to visualize our population continue. Census Dotmap is a nationwide interactive map that displays 308,450,225 dots, one for each person counted by the 2012 Census. Following are several images from St. Louis. The site allows the user to zoom in to any location.

{a glance at central STL shows how relatively few people live adjacent to downtown}

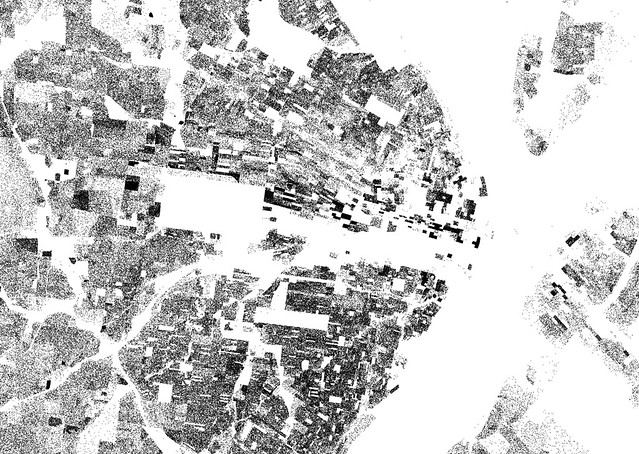
{St. Louis City/County centered on Forest Park – various parks and the railyards separating north and south are clearly visible}

{St. Louis County centered at I-64 and I-270 – highlights the region's sparsely populated center of wealth}

{the St. Louis Metropolitan Region}

{the St. Louis region overlayed on a Google Map}

{the Census Dotmap website allows the user to zoom in on any location in the US – click image to visit site}
Previous nextSTL coverage of the 2010 Census:
Exodus Continues: St. Louis City Loses 29,000 Residents
The 2012 Census Pt I: The State of St. Louis
The 2012 Census Pt 2: The State of St. Louis
In St. Louis Population Decline No Longer Good or Bad, "It Just Is"
